

Bitcoin price has struggled to recover from six consecutive weekly declines, with ETF withdrawals and falling futures positions leaving the cryptocurrency close to its July trading range.
Summary
- Bitcoin price trades near $64,600 after six consecutive weekly declines, remaining below key technical resistance levels.
- US spot Bitcoin ETFs recorded $1.07 billion in outflows during the November 9–13 trading week.
- Bitcoin futures open interest fell 8% from November 11 levels to 645,750 BTC during selloff.
- Bitcoin’s 62,000–63,000 support area remains under scrutiny, with resistance near $67,000 and again near $70,000.
- Bitcoin liquidations totaled $91.21 million over 24 hours, including $57.81 million in leveraged short positions.
BTC price fell to $62,029 on November 15, its lowest price since July 13, before recovering above $64,000.
According to crypto.news market data, Bitcoin price was trading at around $64,600, up 0.27% over 24 hours but down 12.68% over seven days. Trading volume reached $33.28 billion, while its market capitalization stood near $1.3 trillion.
The decline has brought Bitcoin back to prices last seen before its rally to $87,392 in September. In its November 16 market report, Bitfinex identified futures deleveraging, losses among recent buyers, and ETF withdrawals as the main selling pressures, without identifying a single event responsible for the drop.
Bitcoin ETF outflows continue as institutional buying slows
US spot Bitcoin ETFs lost $185.4 million on November 13, Farside Investors data showed. BlackRock’s IBIT accounted for $143.5 million, while Fidelity’s FBTC recorded $41.9 million in withdrawals. Total outflows reached $1.07 billion during November 9–13, following $1.28 billion in the preceding week.
Bitfinex calculated that the funds had lost $2.99 billion over 11 trading sessions starting October 30. Only one of those sessions recorded positive flows. The exchange said three consecutive days of substantial inflows would help establish whether ETF demand had returned.
Despite the withdrawals, Strategy continued buying Bitcoin. The company disclosed in a November 16 filing that it purchased 485 BTC for $33.4 million between November 9 and 15. Its holdings reached 850,849 BTC, acquired at an average of $75,452 per coin, including expenses.
In a post on X, analyst Ali Martinez claimed that large entities had “sold or redistributed” 48,618 BTC worth $3.4 billion over two weeks. His figure includes redistribution, not just confirmed market sales.
Futures liquidations accompany the Bitcoin selloff
Leveraged trading has added to the volatility. CoinGlass liquidation data for the latest 24-hour period showed $273.93 million in liquidations across cryptocurrencies, affecting over 80,000 traders. The largest recorded order was a $4.15 million BTC-USD position on Hyperliquid. Bitcoin accounted for $91.21 million, including $57.81 million in shorts and $33.40 million in longs.
The decline in open interest followed renewed leverage. As crypto.news reported on November 11, outstanding futures positions had risen 3.3% to 701,900 BTC between November 8 and 11 even as Bitcoin fell 2.6%.
During the November 14–15 selloff, Bitfinex recorded an 8% fall in futures open interest from its November 11 level to 645,750 BTC. The exchange cited $2.01 billion in crypto liquidations within 24 hours, with long positions accounting for 83% of the total.
Funding rates had fallen from roughly 11% annualized on November 10 to a range between slightly negative and 5% across trading platforms. Bitfinex analysts described the bounce from Sunday’s low as driven partly by short sellers closing positions, without a clear pickup in fresh buying.
Bitcoin price returns to a key July trading range
On the price chart, Bitcoin remains below several important moving averages. ANovember 16 technical review placed its 200-day average near $72,920 and its 20-day average around $74,355. The daily RSI stood near 24, indicating oversold conditions, while the MACD remained negative.
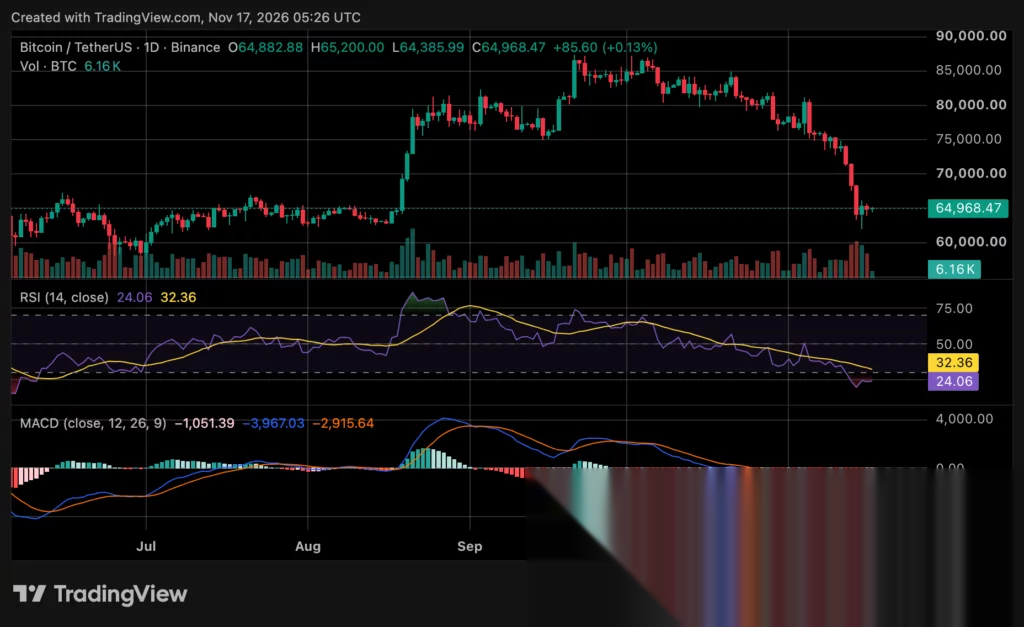
Bitcoin price traded between $61,300 and $67,000 from early July through mid-August. During that period, around 1.4 million BTC were acquired at prices between $60,000 and $65,000, compared with roughly 305,000 BTC purchased between $55,000 and $60,000.
The immediate support area sits around $62,000–$63,000. A break below $61,300 would leave $60,000 in focus, while the July 1 low at $57,803 remains a deeper reference point. Above current prices, $67,000 is the first hurdle, followed by $69,400–$70,000.
“We expect the 15 November low of $62,029 to be retested before that process is complete,” Bitfinex wrote, referring to selling pressure from futures traders, recent buyers, and ETF investors.
A November 14 price analysis found that Bitcoin had already fallen below its 200-week moving average near $67,992. Options data cited by Bitfinex implied a trading range of $61,800–$69,400 through November 20, while demand for puts at $63,000 and $60,000 showed continued interest in downside protection.
Higher bond yields add to pressure on Bitcoin
In traditional markets, the US 10-year Treasury yield traded near 5.14% on November 16, according to Greystone’s bond commentary, as investors assessed persistent inflation and the possibility of another Federal Reserve rate increase. October core consumer prices rose 0.3%, reinforcing expectations of tighter monetary policy.
Investor attention now turns to Nvidia’s November 17 earnings and the Federal Reserve’s November 18 release of minutes from its October policy meeting. Bitfinex reported that shorter-dated Bitcoin options carried higher implied volatility than December contracts ahead of those events.