
Bitcoin traded near $81,400 on Oct. 16 after rebounding from a weekly low of $79,800, leaving its recovery dependent on holding the 50-day moving average and breaking a pattern of lower highs.
Summary
- Bitcoin hovered near its 50-day moving average at $81,279 after slipping below $80,000 this week.
- Trader Ardi identified $84,200 as the level needed to break the local bearish structure.
- Weekly RSI held above 50, while the daily chart showed weaker short-term momentum.
- CoinGlass’s one-week heatmap showed a large overhead liquidation cluster around $84,300–$84,700.
Bitcoin’s daily chart showed a price of $81,345.75, down 1.09% for the session, at 5:38 p.m. UTC. The weekly chart captured a minute later placed BTC at $81,449.99, down 2.77% from the week’s opening price.
The rebound above $80,000 has preserved a nearby support area, but Bitcoin has struggled to build on it. Following September’s advance toward $87,000, successive recovery attempts have stalled below the previous peaks, bringing price back toward its rising 50-day average.
Trader Ardi focused on that deteriorating structure in an Oct. 16 X post, arguing that calls for higher prices were running ahead of the evidence.
“Until we break $84.2K, you simply need to respect that the local swing structure is still bearish.”
Ardi said a break above that pivot would prompt him to consider long positions toward the top of the trading range. His bullish scenario therefore depends on Bitcoin first clearing resistance rather than simply bouncing from support.
Bitcoin’s recovery runs into a familiar $82,000 hurdle
The first obstacle sits closer to the current price. Bitcoin needs to regain $82,000 and sustain the recovery through the latest daily high near $82,941 before Ardi’s $84,200 threshold comes into view.
The $82,000 area has already featured in analysts’ assessments this month. In comments reported on Oct. 1, ViaBTC chief analyst Jeff Ko and Bitget Wallet research lead Lacie Zhang identified it as an important support level. Zhang warned that losing the $82,000–$82,500 zone could accelerate a decline toward $80,000, according to the report on Bitcoin’s October support. crypto.news
Bitcoin has since traded through that downside area. Recovering the former support would give the rebound more substance, while another rejection would leave the recent sequence of lower highs intact.
Crypto analyst Jesse Olson also maintained a cautious view in an Oct. 16 post.
“BTC remains bearish on the daily chart.”
Olson said Bitcoin was heading toward the lowest daily candle close of the correction. His assessment focused on the closing-price trend, which remained under pressure despite the recovery from the weekly low.
The 50-day average faces a close test
The daily chart places Bitcoin’s 50-day moving average at $81,279, only about $67 below the displayed price. Bitcoin is therefore testing a trend reference that has risen beneath the market during the recovery from August.
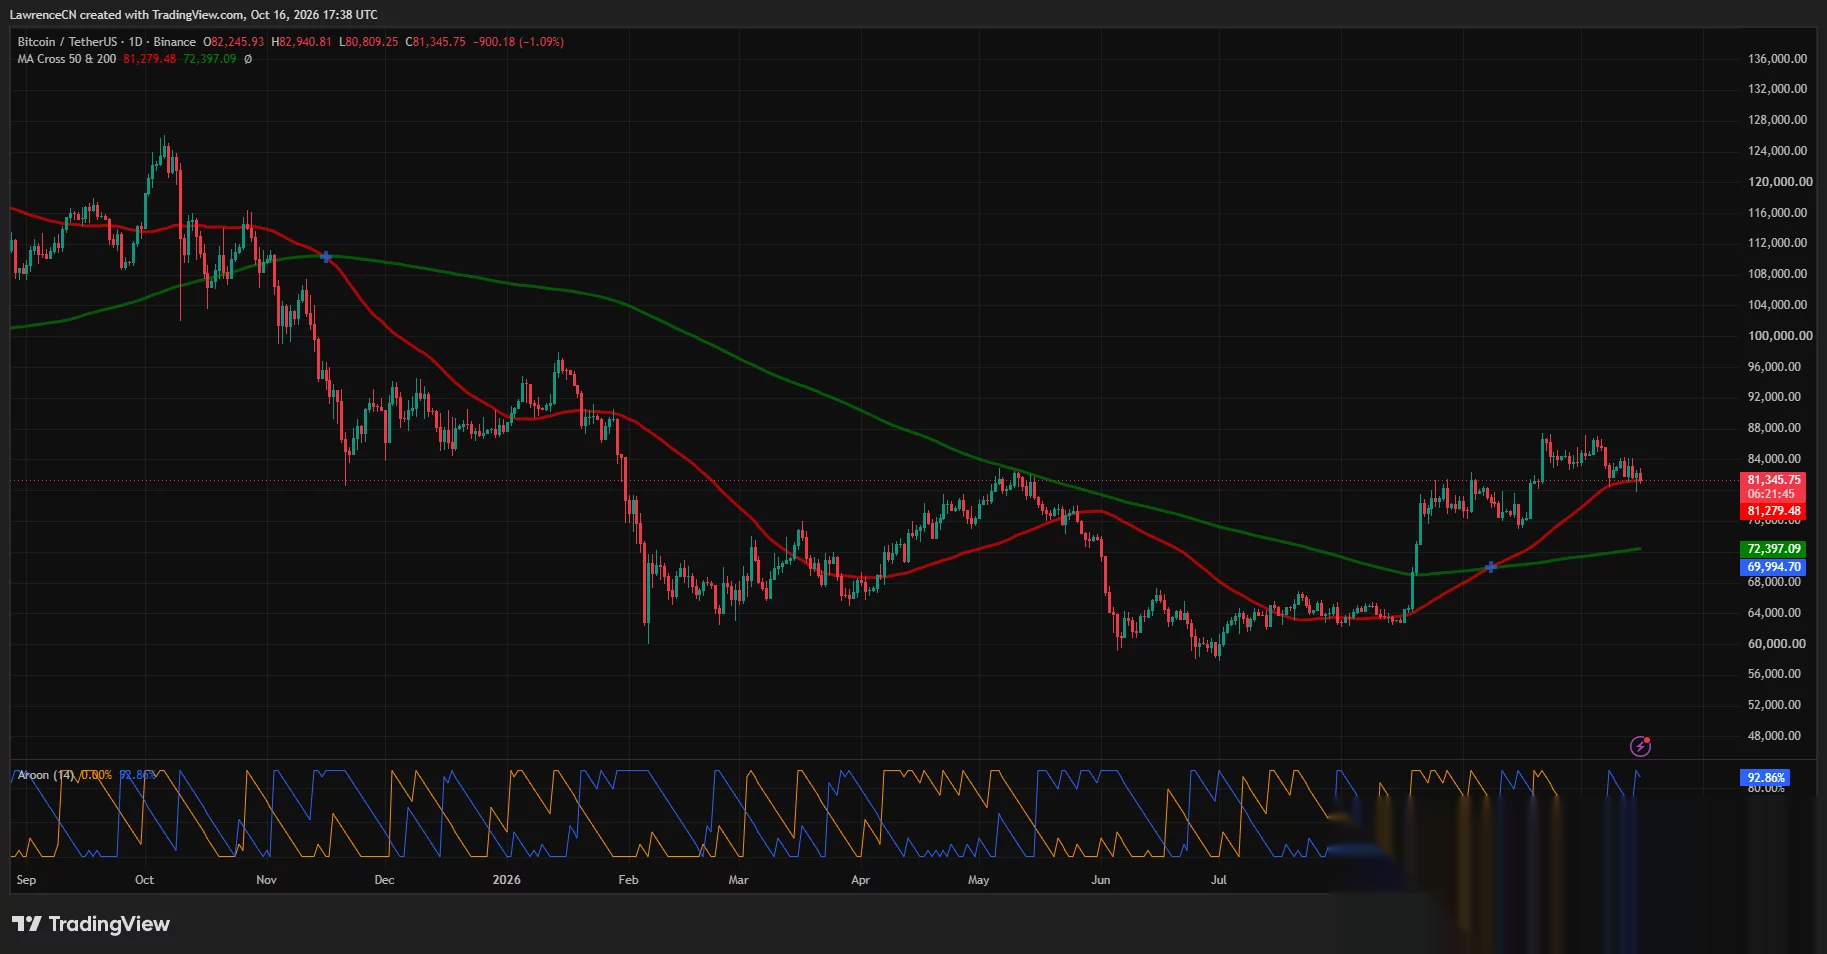
Holding that average would preserve a nearby base for another attempt at $82,000. A sustained break below it would instead put the week’s $79,800 low back in focus.
The daily Aroon indicator favors caution. Aroon Up stood at 0%, while Aroon Down reached 92.86%, showing that a recent low dominates the indicator’s 14-session window while a fresh high remains absent.
That reading fits the retreat from the September and early October peaks. Price has returned to support without first breaking the downward sequence identified by Ardi.
The longer daily trend has more room beneath it. Bitcoin’s 200-day moving average stood at $72,397, well below the immediate trading area, while the 50-day average remained above it following an earlier bullish crossover.
The current test is consequently concentrated around the faster average and recent price lows. Losing $80,000 would weaken the September recovery before it threatened the more distant 200-day trend reference.
Weekly momentum holds up better than the daily structure
Bitcoin’s weekly chart offers a less bearish picture. The relative strength index stood at 56.39, above both the neutral 50 level and its displayed average of 51.80.
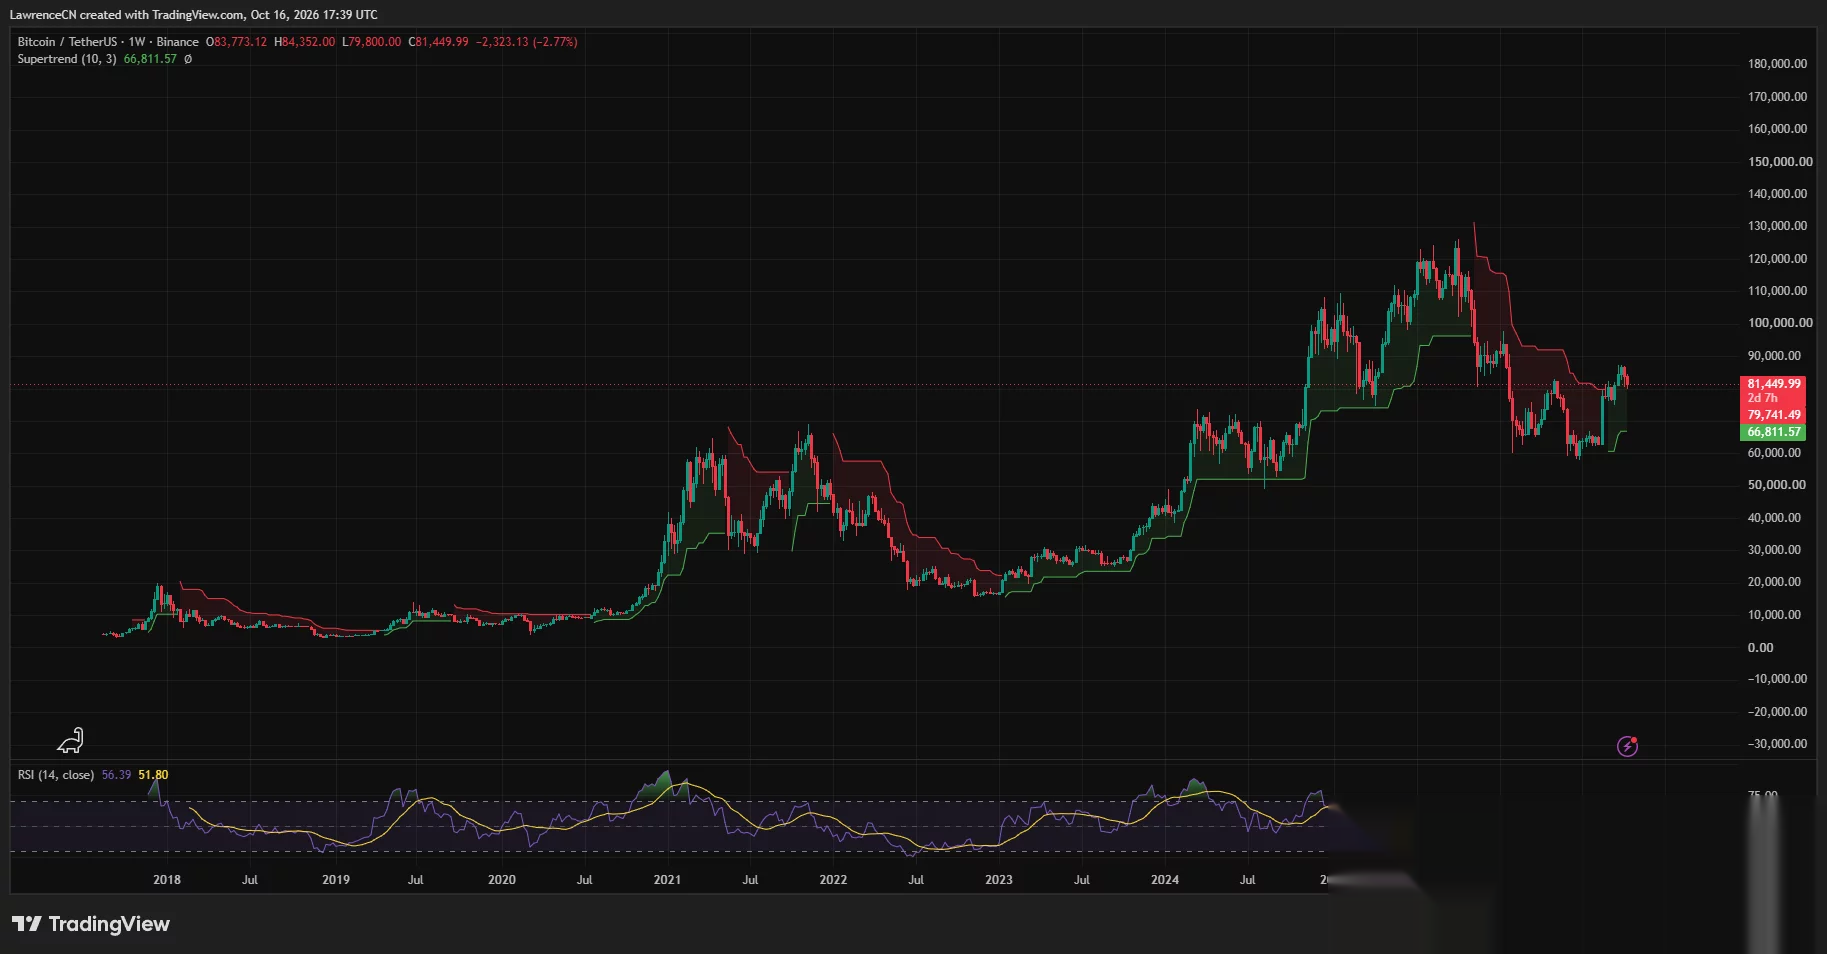
Weekly momentum has therefore retained some strength even as the daily price structure has weakened. The RSI has recovered from its midyear lows, although it remains below the stronger readings reached during earlier advances.
The weekly Supertrend also remained green, with its active line near $66,812. Bitcoin traded well above that level, keeping the indicator’s broader bullish signal intact.
The distance to that line means it offers little protection against a further near-term decline. Bitcoin could lose its immediate support while the weekly Supertrend remains positive.
For the recovery case, the more useful confirmation would come from price clearing the recent lower highs while weekly RSI stays above 50. Until then, the stronger weekly readings coexist with a daily correction.
Liquidation clusters build above the market
CoinGlass’s one-week liquidation heatmap showed its brightest overhead concentration around $84,300–$84,700, just above Ardi’s breakout threshold. Smaller clusters appeared near $83,300–$83,700.
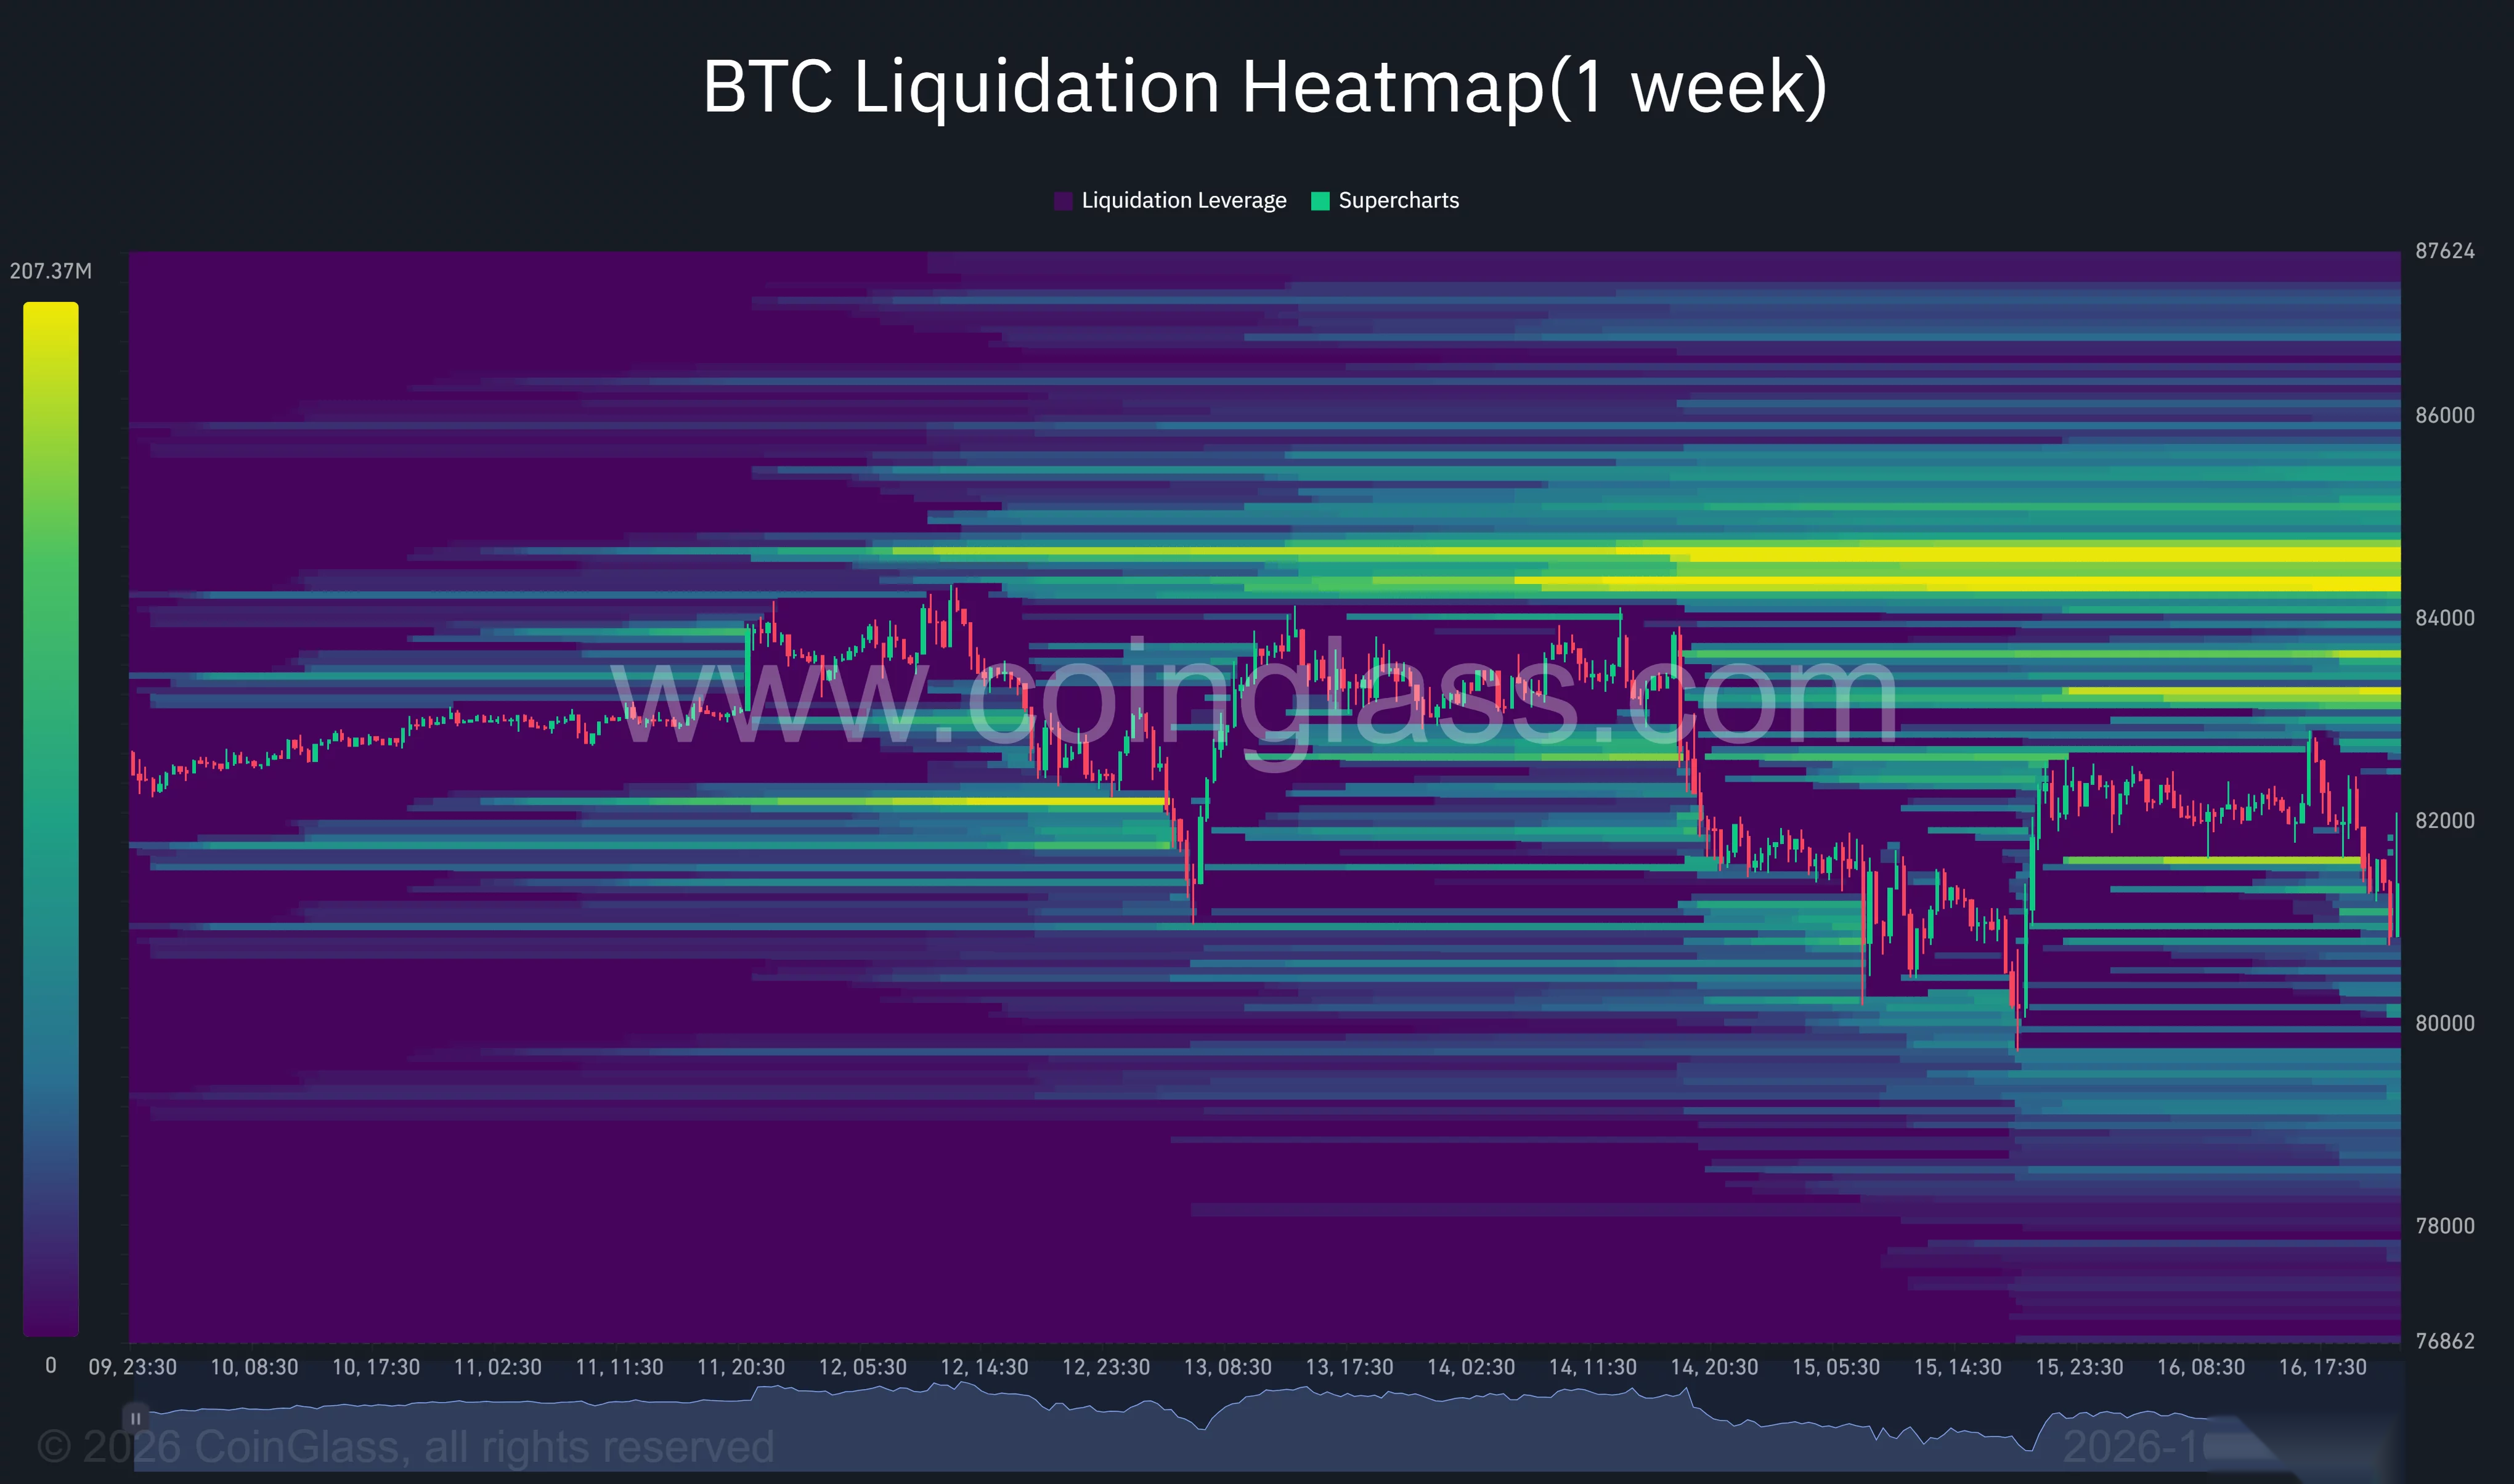
Those estimated liquidation levels give a recovery through $84,200 an additional derivatives-market hurdle. Reaching the larger cluster could expose short positions to forced closures, although the heatmap does not establish that price will move toward it.
Below the market, visible concentrations extended through roughly $80,000 and $79,000–$79,500. A renewed loss of the weekly low would bring that lower area into the downside scenario.
U.S. inflation remains part of the backdrop. The Bureau of Labor Statistics reported that September consumer prices rose 3.7% annually, up from 3.4% in August. Before the release, BTSE chief operating officer Jeff Mei had warned that hotter inflation could send Bitcoin below $80,000 in comments on the inflation risk to Bitcoin.
Bitcoin’s immediate test remains the $81,279 average and the $79,800 weekly low. Holding that base leaves room for another recovery attempt, but a sustained break above $84,200 would be needed to challenge Ardi’s bearish local outlook.