


Last week, Bitcoin continued to come under pressure and move downward, with the intraday low reaching $79,775, breaking below the previous week's low of $80,400, and the weekly top is basically confirmed.
Looking back, this round of market action starts from July 1. The coin price rebounded all the way from the low of $57,820 to $87,399 on September 21. We have consistently characterized this move as an oversold rebound rather than the start of a bull market. After peaking on September 21, the market entered a correction, which has now run for 27 trading days, with a maximum decline of 8.72%. Last week's low happened to fall into the target zone of $78,000–$80,500 that we previously gave. On the 4-hour chart, both models also simultaneously showed bottom divergence. Therefore, the focus this week is: whether a bottom can be confirmed near $79,775, thereby opening up room for a wave ⅱ rebound.
HYPE also weakened last week. After breaking below the short-term ascending channel, the price fell all the way, with the low touching $76.07, exactly falling within our predicted range of $75–$77. This correction began from the high of $97.98 on September 23. At present, divergence has appeared in the 4-hour-level decline, and downward momentum has clearly weakened. The key this week is $75.10: if it holds, the correction will most likely come to an end; if it is lost, it may escalate into a weekly-level correction.
Summary of the core viewpoints for trading this week:
• Analysis of Bitcoin's daily-level trend structure (see Part One for details)
• Analysis of Bitcoin's hourly-level trend structure (see Part Two for details)
• Bitcoin's market forecast for this week and medium- and short-term trading strategies (see Part Three for details)
• Analysis of HYPE's hourly-level trend structure (see Part Four for details)
• HYPE's market forecast for this week and short-term trading strategies (see Part Five for details)
I. Analysis of Bitcoin's Daily-Level Trend Structure
In the previous weekly review of this column, using the self-created "52-week moving average confirmation method" combined with the Elliott wave theory system, we analyzed from multiple dimensions the nature of the current trend in the BTC market, as well as the possibility of the coin price seeing a阶段性 high on September 21, and made a forecast for the trend structure after the high was formed.
This week, we will continue the Elliott wave theoretical framework to conduct further research and judgment on the later market trend.
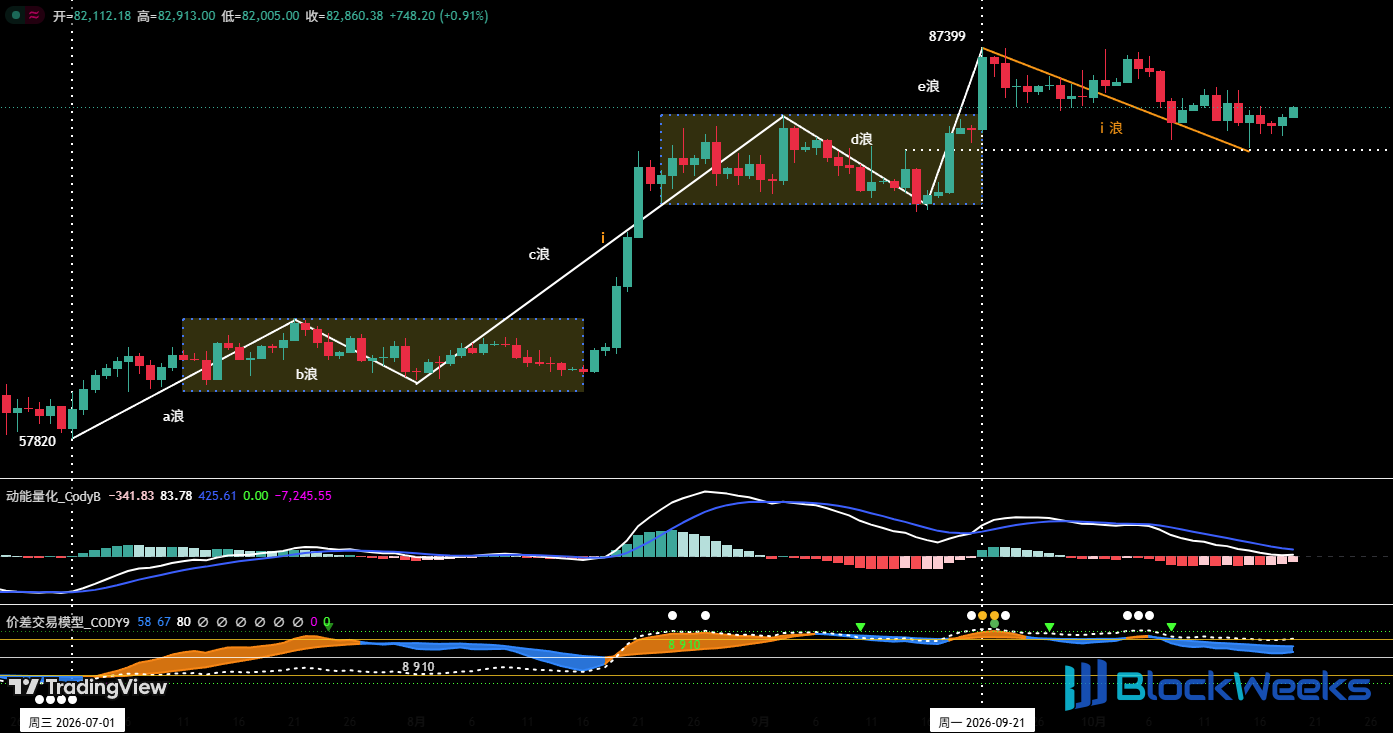
Figure 1 Bitcoin daily candlestick chart
1. Review of the previous weekly review's judgments
The previous weekly review, from the two dimensions of daily and weekly charts, made three progressive judgments on the nature of the BTC market trend and the daily trend structure:
①. The current round of rebound in the coin price starting from the low of $57,820 on July 1 should still be defined as an oversold rebound, and is not yet sufficient to confirm the establishment of a bull market.
②. Daily five-wave termination: BTC's five-wave rebound starting from the July 1 low terminated at the阶段性 high of $87,399 on September 21.
③. Weekly top confirmation: If the intraday low of the previous weekly K-line breaks below the previous week's low of $80,400, then the weekly top pattern is basically established, confirming from the larger cycle that September 21 is the阶段性 high.
④. Daily three-wave correction: If the above阶段性 high is established, then the daily-level correction starting from that point will most likely advance in a three-wave structure.
2. Weekly top established as expected
The confirmation condition set in the previous weekly review has been triggered: from the actual trend, last week's lowest price of $79,775 has broken below the previous week's low of $80,400, and the recent 4 weekly K-lines form a "strong top fractal," the weekly top pattern has basically been established, and the阶段性 high of September 21 has been confirmed at the weekly level.
3. Analysis of the current trend structure (Figure 1)
①. Wave ⅰ (corrective wave): from September 21 to now
• Starting point: $87,399
• Has run for 27 trading days (still ongoing)
• Maximum decline within the range: 8.72%
②. The current lowest price of $79,775 has fallen into the target area of $78,000–$80,500, and the probability that the wave ⅰ correction ends here is extremely high.
③. After wave ⅰ ends, a wave ⅱ rebound is expected to unfold.
II. Analysis of Bitcoin's Hourly-Level Trend Structure

Figure 2 Bitcoin _4-hour candlestick chart
1. As shown in Figure 2: We introduce the Chan theory system as a cross-validation perspective outside the Elliott wave framework, and analyze the BTC trend structure in detail on the 4-hour cycle scale:
①. 4-hour decomposition of daily wave ⅰ:
The daily i-wave correction starting from the September 21 high of $87,399 (endpoint 0) can be clearly divided on the 4-hour chart into six segments from (0-1) to (5-6).
②. Construction of a descending pivot:
Among them, the three segments (1-2), (2-3), and (3-4) overlap with each other, forming a descending pivot.
③. Trend deduction:
The market is currently running the (5-6) rebound segment. If, after it ends, the subsequent pullback does not break below endpoint 5, then the probability that the daily i-wave correction ends at endpoint 5 (about $79,775) is significant. Otherwise, the market may continue to probe lower, with focus on support near $78,000.
2. Analysis using the self-built model system (Figure 2):
①. The "momentum quantification model" shows that the comparison between endpoint 3 and endpoint 5 has formed a bottom divergence state; the model's two signal lines are intertwined and, as they run near the zero axis, are about to cross upward. If they successfully stand above the zero axis, the 4-hour level will enter a strong area.
②. The "price spread trading model" triggered a bottom warning signal near endpoint 3;
③. The two independent models, comparing endpoint 3 and endpoint 5, simultaneously confirm bottom divergence, constituting cross-validation.
3. In summary, the trend structure research and the dual-model divergence signals mutually verify each other, and the probability that the coin price ends the daily i-wave correction near endpoint 5 (about $79,775) is extremely high. At present, it is not advisable to chase the decline.
III. Bitcoin Weekly Market Forecast and Trading Strategy
1. BTC Weekly Price Trend Forecast
Core view for this week: Focus on the termination point of the daily wave i correction, as well as the subsequent wave ii rebound.
2. Core Resistance Levels
• First resistance zone: around $84,500–$85,500 (previous important level)
• Second resistance zone: $87,500–$90,000 area (previous important level)
3. Core Support Levels
• First support level: $78,000–$80,500 area (previous important support level)
• Second support level: $74,500–$76,000 area (previous important support level)
• Third support level: $69,100–$70,500 area (previous important support level)
4. Trading Strategy for This Week (Excluding the Impact of Sudden News)
①. Medium-term strategy:

Figure 3 Bitcoin _ Daily K-line Chart: (Position Monitoring Model)
Position Monitoring Model: As shown in Figure 3, the coin price has broken through the "long-short channel"; it is currently in the pullback confirmation stage. Therefore, the current medium-term strategy is mainly to stay in cash and wait and see.
②. Short-term strategy: Use 30% of the position, set stop-loss points, and based on support and resistance levels, look for "price spread" opportunities. (Use 30-minute/60-minute as the operating cycle).
③. In short-term operations, in order to dynamically adapt to complex market developments, we have prepared A/B operating plans in advance.
• Plan A: Light long position in strong support zone.
• Entry: If the coin price adjusts to the $78,000–$80,500 area this week and shows a clear stabilization pattern, and the quantitative model simultaneously issues a bottom signal, a light long position can be established, with the position controlled within 30%.
• Risk control: Set an initial stop-loss level.
• Exit: When the rebound reaches near an important resistance level and combined with model signals, positions can be closed in batches to take profits.
• Plan B: Light short position at strong resistance level.
• Entry: If the coin price rises to the above resistance area and shows a clear pattern of pressure and pullback, and the quantitative model simultaneously issues a top signal, a light short position can be established, with the position controlled within 30%.
• Risk control: Set an initial stop-loss level.
• Exit: When the price adjusts to near an important support level and combined with model signals, positions can be closed in batches to take profits.
IV. HYPE Hourly-Level Trend Structure Analysis
In the previous weekly review, this column clearly pointed out: HYPE was at that time in the stage of retesting confirmation after breaking below the lower rail of the short-term ascending channel. If the breakdown was confirmed as valid, the previous week would maintain a correction pattern, with the downside target seen at the $75–$77 area. From the actual price action, after the valid breakdown was confirmed, the price correction accurately fell into this target zone, with the lowest reaching $76.07. The actual price action last week was highly consistent with the forecast view.

Figure 4 HYPE_4-hour K-line Chart
1. Decomposition of the Daily Correction at the 4-Hour Level
As shown in Figure 4: The daily correction that HYPE launched from the September 23 high of $97.98 can be decomposed on the 4-hour framework into a five-segment downward structure from (89-90) to (93-94).
2. Construction of the Descending Central Zone
①. Based on the overlap of the three trend segments (90-91), (91-92), and (92-93), a descending central zone is constructed.
②. Among them, (89-90) is the central zone entry segment, and (93-94) is the central zone exit segment.
3. Judgment Based on the Central Zone Trend Structure (Baseline Scenario)
Currently, the central zone exit segment (93-94) is in progress. After comparing the downward momentum, this segment shows a clear momentum divergence relationship with the entry segment (89-90) (divergence means the downward momentum is exhausted). Therefore, after this segment ends, a rebound segment is expected to run; if the subsequent pullback cannot break below endpoint 94, then the probability is extremely high that the daily correction starting from $97.98 will terminate at endpoint 94.
4. Risk Scenario of Price Breaking Below the September 15 Low (Extremely Weak Scenario)
If the daily correction launched on September 23 breaks below the September 15 low of $75.10, then this round of correction may escalate to the weekly level. Not only will the correction time be further extended, but it may also test the support of the long-term ascending trendline.
V. HYPE Weekly Market Forecast and Short-Term Trading Strategy
1. HYPE Weekly Price Trend Forecast
①. Core resistance levels:
• First resistance level: $80–$82 area
• Second resistance level: $88–$90 area
• Third resistance level: around $95–$100
②. Core support levels:
• First support level: $75–$77 area (strong support)
• Second support level: $68–$70 area
③. Core view for this week:
The first support level ($75–$77 area) is the long-short dividing line; this week, focus on observing the outcome of the long-short battle in this area.
2. HYPE short-term trading strategy for this week
①. If it stabilizes, try a light long position (as long as strong support is not broken):
If the price stops falling and stabilizes above 75.10 USD and continues to rise, those with no position may consider trying a light long position, with the position size controlled within 30%, with the first target at the first resistance zone of 80–82 USD, and set a stop-loss and strictly execute it.
②. If the level is broken, stay on the sidelines:
If the price falls below the 75.10 USD support level, then the strong support level has been lost, and it is recommended to temporarily stay in cash and wait for a clear direction before acting.
VI. Special Notes
1. When opening a position: immediately set an initial stop-loss level.
2. When profit reaches 1%: move the stop-loss to the entry cost price (break-even point) to ensure the safety of principal.
3. When profit reaches 2%: move the stop-loss to the position of 1% profit.
4. Continuous tracking: thereafter, for every additional 1% profit in the coin price, move the stop-loss level by 1% accordingly, dynamically protecting and locking in gains.
The financial markets change rapidly, and all market analyses and trading strategies need to be adjusted dynamically. All views, analytical models, and operational strategies involved in this article come from personal technical analysis and are for personal trading log purposes only; they do not constitute any investment advice or basis for operations. Markets carry risks, and investment requires caution; please do not make decisions based on this.