



Author: Pantera Capital
Compiled by: Jiahuan, ChainCatcher
Five Key Findings
Tokenization is undergoing a structural shift: issuing tokens on-chain is no longer difficult, and the next phase will focus on building compliant, liquid secondary markets with more efficient use of capital. Although the total value of tokenized assets across categories continues to expand, trading volume and market participation remain clearly differentiated.
This report combines quantitative data as of June 30, 2026, with key operational developments in the third quarter, including Robinhood Chain's performance as of August 31 and key policy updates in September.
Among the 671 assets and $331.8 billion market size we track, growth is expanding from stablecoins into more areas. From the first quarter to the second quarter, the tokenized value of non-stablecoin assets grew by 13.3%, and opportunities across different asset classes and use cases have become more diverse.
At the same time, tokenization is expanding its applications along multiple paths. Traders gain exposure to stock prices through on-chain derivatives, consumer-facing platforms such as Robinhood bring tokenized assets into new distribution channels, and lending markets allow tokenized collateral to play a role.
For banks, asset managers, and wealth management platforms, these changes create opportunities to serve clients through new types of trading, investment, and financing products.
This report examines where this activity is emerging and what is needed to support it. The five key findings are as follows:
On-chain stock trading shows that there is significant demand for price exposure. In June, stock perpetual contract trading volume on Hyperliquid and Lighter reached $67.8 billion, roughly 16 times the observable spot trading volume of tokenized stocks on-chain. These derivatives allow traders to establish positions without holding the underlying tokenized assets.
This comparison shows that demand for price exposure is active, but because of differences in leverage, repeated trading, and statistical coverage, it is not a comparison of actual capital invested or the number of unique users.
After Robinhood Chain launched, it achieved initial results in expanding the distribution of tokenized stocks and ETFs. Its curated products include well-known companies such as Nvidia, Apple, and Tesla, as well as ETFs such as SPY and QQQ. In the first month after its July 1 launch, the value of tracked tokenized assets increased to about five times its original level.
Trading also grew: weekly RWA trading volume rose from $5 million in the first week to $887.5 million in the last week of August, and its share of the chain's DEX trading volume rose from 0.1% to 12.9%. These data indicate that the product launch is translating into actual holdings and growing trading interest, but early wallet balances remain relatively concentrated.
Access conditions determine where public markets can form. Among 110 non-stablecoin products each worth at least $10 million, open-access products accounted for 41% of total value at the end of June, yet contributed 99.8% of observable spot trading volume that month. Transfer restrictions may narrow the range of eligible buyers and trading venues.
Product composition also matters: permissioned assets are mainly concentrated in funds intended for yield generation, so this comparison cannot measure the impact of access conditions alone.
Secondary market trading activity is not a universal measure of tokenization success. Beyond access restrictions, low spot trading volume may also mean that a product was designed to be held rather than frequently traded.
For stock tokens, turnover can reflect liquidity conditions, market depth, and execution quality; for tokenized Treasury funds, yield and reliable redemption may be more important than trading frequency; for credit assets used as collateral, borrowing activity and reliable liquidation or redemption arrangements matter most. Evaluating these products requires matching metrics to their intended use.
Institutions should focus on the market infrastructure that can be built under the current regulatory framework. The CLARITY Act failed to advance in the Senate process on September 15, and more comprehensive U.S. market structure legislation remains unresolved.
However, the conditional exemption issued by the U.S. Securities and Exchange Commission (SEC) on September 17 for certain tokenized stock trading venues and liquidity providers offers a concrete path for further development. These changes require institutions to develop plans on a product-by-product basis: first determine the viable regulatory path, then build infrastructure within that scope to serve eligible investors.
For trading-oriented assets, this means bringing in qualified market makers and trading venues that can meet product transfer requirements; for yield-oriented funds, reliable redemption may deserve priority. As the overall framework gradually improves, institutions can use these specific measures to improve client access and product availability.
Part One: How Are Tokenized Assets Traded, Held, and Used for Financing?
Open-access products contributed 99.8% of observable spot trading volume in June
Tokenized assets are numerous, but a token being on-chain does not mean it automatically has a public market. Many tokens are still mainly transferred between wallets, or held to earn yield.
In June, BUIDL's wallet-to-wallet transfers amounted to $441 million, USTB's to $339 million, and Spiko's European fund to $353 million. These transfers may involve subscriptions, redemptions, custody, collateral, yield strategies, and other operational activities. They show that the tokens are being used on-chain, but they do not represent deduplicated investment fund flows, nor do they represent public price discovery.
Public secondary market trading requires eligible buyers and sellers, a trading venue that supports the product, and an inventory of the asset available for participants to trade. Products with zero spot trading volume also have no token inventory of meaningful size in their related DEX pools. For permissioned products, transfer restrictions may prevent ordinary public pools from functioning properly. Investors may instead use issuer channels or permissioned channels, and these activities are not included in spot trading data. Therefore, the absence of observed spot trading does not prove that investors cannot exit.
This section divides products into five asset categories: interest rate, equity, commodity, credit, and private fund. Interest rate covers U.S. and non-U.S. government debt and money market instruments; credit covers private credit and corporate credit; private fund covers actively managed strategies and private equity. Synthetic yield-bearing dollar tokens such as USDe are classified as stablecoins and are not included in this analysis sample.
Products are also divided into two groups, open-access and permissioned, based on the rules at the time of token transfer, rather than the eligibility requirements at the time of investor subscription.
Open-access products impose no identity or address restrictions at the transfer stage: any address can receive the token and trade it on venues that support the product, even if the issuer still requires KYC identity verification at the time of share creation or redemption. Permissioned products, by contrast, impose restrictions on the transfer itself, and tokens can only move between approved addresses.
The June 2026 sample contains 110 non-stablecoin products, each with a month-end market value of at least $10 million. Among them, 51 permissioned products together are worth $16.5 billion, and 59 open-access products together are worth $11.5 billion.
Permissioned products account for 59% of the sample's total value, yet contributed only 0.2% of observable spot trading volume; open-access products account for 41% of total value and contributed 99.8% of trading volume, or $4.8 billion. Overall, open-access products' June trading volume was roughly equal to 41% of their market value, but trading remained concentrated in a relatively small subset of products.
BlackRock's BUIDL, Franklin's iBENJI, and Hashnote's USYC all restrict token recipients. Tether Gold, PAX Gold, and Syrup USDC have no such transfer restrictions. Almost both groups of products screen investors at subscription, and the real difference lies in whether the token can subsequently enter public trading venues.
Access conditions and asset categories are intertwined to some extent. Permissioned products are concentrated in categories where holding is the primary use: 81% of interest rate asset value belongs to permissioned products, 8% for equity, and zero for commodities. Interest rate assets account for $16.7 billion of the sample's $28 billion total value, so about four-fifths of all permissioned asset value is concentrated in this category, which is typically bought to earn yield and redeemed with the issuer.
The gap of "59% of value but only 0.2% of trading volume" comes partly from product composition, not just access conditions. 71% of private fund assets are permissioned, but their June turnover rate was 9.4%; 46% of credit assets are permissioned, with a turnover rate of 9.5%. Both are about 100 times the 0.1% turnover rate of interest rate assets.
Permission requirements limit which trading venues a token can enter, but how large the limitation is also depends on whether the product was originally intended for trading.
Free transferability does not guarantee liquidity
Category-wide turnover rate is calculated by adding up the trading volume of all products in that category and dividing by their combined market value. A small number of very actively traded tokens can push this figure up even if other tokens barely trade. Therefore, a high category turnover rate does not mean that individual products are broadly active.
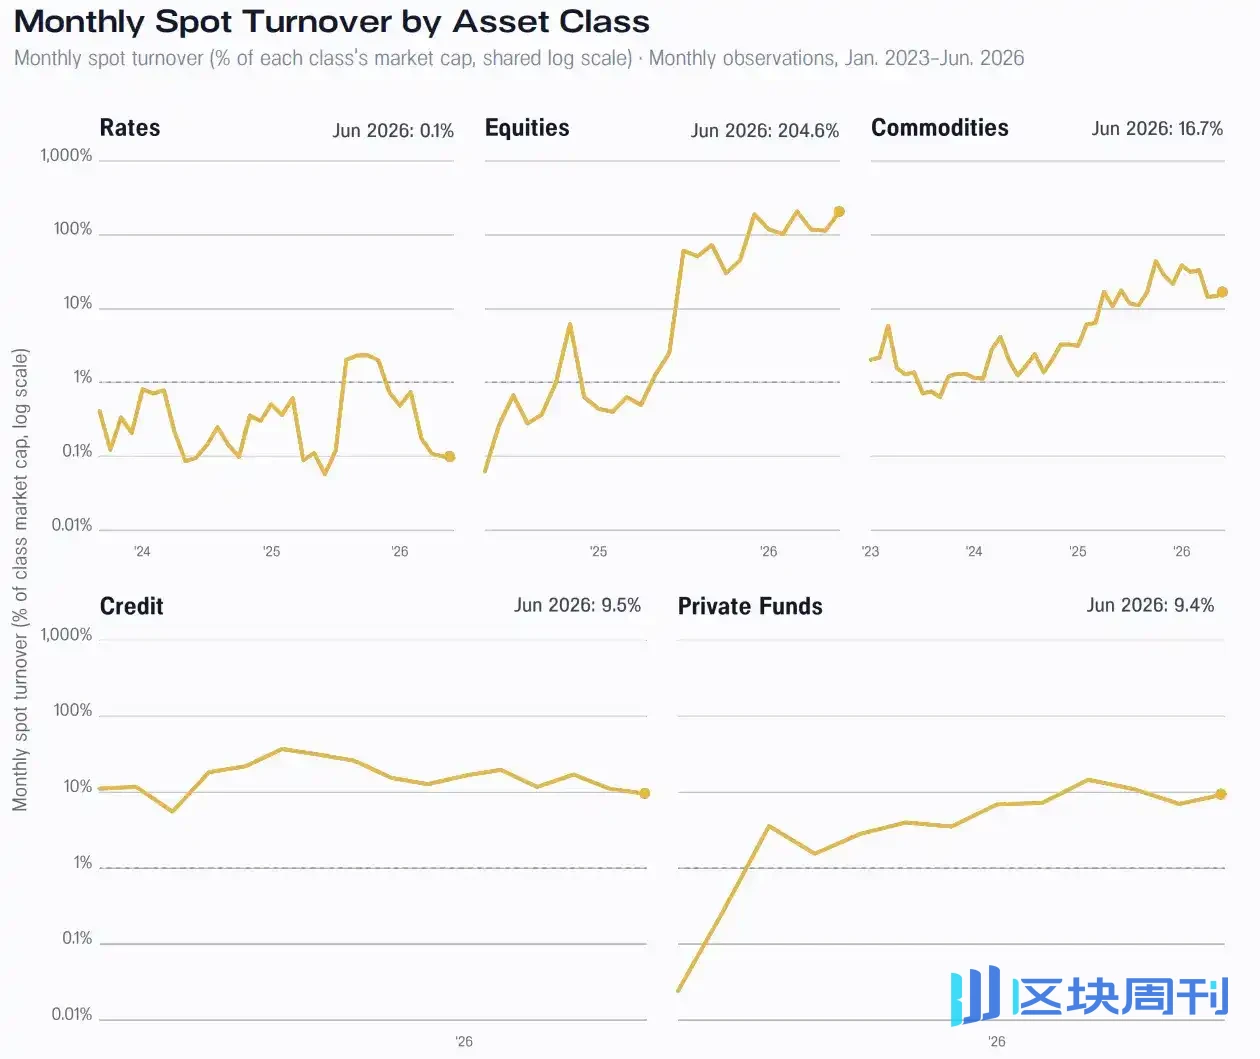
Equities illustrate this distinction well. In the sample with market values above $10 million, only 12 of 47 equity products had a turnover rate below 1%. These products together are worth $260 million, about 18% of the equity category's $1.5 billion total value. Most equity asset value met the threshold, while a few highly active tokens traded at multiples of their own size, pushing the entire category's turnover rate to 204.6%.
Interest rate products, by contrast, have long maintained low turnover rates. Of the 42 months observed, 38 had monthly turnover rates below 1%, and June was only 0.1%. Treasury funds are typically held to earn yield and redeemed through the issuer; equities and commodities may trade more frequently around market prices.

Figure: Monthly spot turnover by asset class. In June 2026, equities were 204.6%, rates were 0.1%, and commodities, credit, and private funds were 16.7%, 9.5%, and 9.4%, respectively.
Products lacking trading also exist within the open-access group. Products worth $3.4 billion, accounting for 29.5% of the group's total value, had observable spot turnover below 1% in June. Of that, about $3 billion came from two products: Ondo's USDY, with a market cap of $2.1 billion and turnover of 0.1%; and Spiko's European fund, with a size of about $900 million, for which no spot trading was observed.
The 1% threshold is a uniform standard for measuring activity in public secondary markets; it is not a definition of liquidity.
Grouping U.S. and non-U.S. government debt into one category also obscures real differences in usage. The U.S. dollar is the common unit of account in on-chain markets, and pricing, quoting, and collateral conventions are all built around the dollar. As a result, tokenized U.S. short-term Treasuries can be held, used as collateral, and redeemed without an additional currency choice.
Euro, Brazilian real, and Mexican peso products face a different situation: the natural holder base for the local currency is smaller, local-currency quotes are fewer, and for most on-chain counterparties there is an implicit foreign exchange conversion. Even instruments with similar credit quality and structure may therefore show different turnover rates. Non-U.S.-dollar government debt currently accounts for only about 7% of rate assets, and aggregate data cannot yet clearly show this difference.
Rate assets have 0.1% turnover, equities 204.6%
Trading infrastructure faces a "chicken-and-egg" problem. Market depth can only accumulate if trading volume and the fee income of liquidity providers grow. More volatile, actively traded assets are easier to launch markets for, because turnover can generate enough fees to attract liquidity providers.
Low-turnover instruments cannot do this. Tokenized short-term Treasuries that trade only a few times a month can hardly generate returns for liquidity providers, so capital leaves, or never enters. Less trading means fewer fees; fewer fees mean thinner market depth; and thin depth in turn discourages the next trade.
This explains why an instrument that is highly liquid in traditional markets may still appear illiquid on-chain. The main constraint is not the quality of the underlying asset, but the design of the trading venue. Automated market makers rely on turnover to generate revenue, and hold-oriented instruments cannot provide enough trading. Request-for-quote execution, market-making incentives, and issuer-supported redemptions are better suited to such products than fee-revenue-dependent pools.
Taking the sale of $10 million in assets as an example, if daily volume is capped at 15% of the observable average daily spot trading volume in June, rate products would need about 126.5 days, while equities would need about 0.5 days. Private funds would need 11.2 days, credit 4.9 days, and commodities 2.8 days.

Figure: Estimated days required to sell $10 million in assets at 15% of average daily spot trading volume by category. This estimate does not include issuer redemption channels and does not account for the price impact of large trades.
This estimate does not include issuer subscription and redemption channels. Eligible investors can redeem directly with the issuer, subject to different timing arrangements. Therefore, even if fund tokens trade rarely, the fund may still offer a practical exit route.
Trading volume tells us how quickly asset value has circulated in the past, but it cannot show how much of an asset can be traded at a given quote. Among the observed products, the largest in-pool inventory on the RWA asset side is Tether Gold, distributed across 109 pool addresses, totaling about $24 million. However, the dataset does not include the price-level state needed to estimate the price impact of large trades, or the internal order books of centralized exchanges.
Assets cover more blockchains, but wallet holdings remain uneven
Asset distribution needs to be measured on three levels: which chains the assets are deployed on, how many addresses hold them, and how much value the largest holdings control.
At the infrastructure level, tracked non-stablecoin assets expanded from being distributed on only 3 chains in January 2023 to 23 chains by June 2026. Over the same period, the share of the largest chain fell from 87.8% to 53.8%, a decline of 34 percentage points; the Herfindahl-Hirschman Index, which measures market concentration, fell from 0.8 to 0.3, with lower values meaning more dispersed distribution.
Multi-chain deployment has already gone from a minority situation to a basic feature of the market. At the end of the quarter, Ethereum still accounted for 53.8% of tracked asset value; Solana's asset value was less than one-fifth of Ethereum's, yet it recorded more holder addresses.

Figure: Changes in non-stablecoin RWA market capitalization on selected chains. Asset deployment has gradually expanded to more networks, while Ethereum still holds the largest asset share.
The number of holders needs to be interpreted together with balance concentration. A large address may represent a single investor, an issuer or treasury management wallet, a vault, or a pooled custody account. On-chain balance concentration and the distribution of actual beneficial ownership may not be the same.
Among interest-rate assets, the largest holding's share of that category's value fell from 89.3% to 18.6%; private funds fell from 74.9% to 27.0%. Equities ended the period at 25.2%, credit at 14.4%, and commodities at 8.9%. As a category expands, this category-level share may decline, but holdings within existing products do not necessarily become more dispersed.
Product-level examples show why both the number of holders and concentration need to be examined: Syrup USDT has 1,105 holder addresses, but the top ten addresses hold 93.0% of the supply; PAX Gold has 91,775 holder addresses, with the top ten addresses accounting for 32.5%.
Therefore, a product is only considered to have dispersed holdings when it has at least 1,000 holder addresses and the top ten addresses hold no more than 90% of the supply.
Scale, trading activity, and dispersed holdings rarely occur at the same time
The 1% turnover threshold and the holdings distribution test divided the June sample into four groups.
Of the 110 products, only 29 passed both screens at the same time, about one quarter. They totaled $6.6 billion in value, 23.5% of the sample's total value, and were all open-access products, including Tether Gold, PAX Gold, Syrup USDC, and OnRe.
Another 18 products met the turnover threshold but had more concentrated holdings, totaling about $1.7 billion in value; 6 products had dispersed holdings but did not meet the turnover threshold, totaling about $4.6 billion in value, including Ondo USDY, Spiko funds, and Franklin BENJI/FOBXX.
The largest group contained 57 products with low turnover and limited holdings coverage, totaling $15.2 billion in value, 54.1% of the sample's total value, yet generating only about $100,000 in total observable spot trading volume. This group includes Hashnote, BlackRock BUIDL, Franklin institutional iBENJI, and BCAP.

Figure: Illustrative distribution of the number of product holder addresses and monthly spot turnover. Gold indicates those that simultaneously pass the liquidity and holding distribution tests, and bubble area is proportional to market capitalization.
There are 10 products with a scale exceeding $250 million, each with fewer than 100 holder addresses, totaling $11.4 billion in value. Even among products that meet the turnover threshold, holder coverage still matters: the dispersed-holding group generated 6.9 times the absolute trading volume of the concentrated-holding group in June.
Adjusting the threshold changes the attribution of products on the edge of the groupings, but the overall picture does not change. Market scale, active trading, and broad holding do not naturally appear at the same time.
The real potential of tokenization is not just putting funds on the blockchain, but changing what these assets can do. When fund shares can be distributed globally, have tradable liquidity, be used as collateral, and connect to programmable markets, their utility as financial assets undergoes a fundamental change. This shift is especially powerful for private markets, improving their liquidity, accessibility, and capital efficiency.
Jonathan Shaffer, Founder and CEO of Fission Labs
Of 48 Whitelist-Only Products, 46 Did Not Meet the Turnover Threshold
Access conditions help explain the differences between groups: can a token enter venues where secondary trading takes place?
Of the 48 whitelist-only products, 46 had turnover below 1%, accounting for 96% of the number of products in that group and 99.1% of the group's market capitalization. All products that simultaneously passed the turnover and holding distribution screens were open-access products.

Figure: Share of market capitalization of assets with monthly spot turnover below 1% under different access regimes. Gold indicates the portion below the threshold, and the corresponding asset amounts are listed on the right.
This does not mean that open access necessarily brings trading. Groups differ in listing support, market making, product design, and investor demand. But in this sample, there is a clear association between access conditions and observable trading activity.
Changing the number of holders, concentration, or minimum balance thresholds affects the specific number of products, but does not change the results related to access conditions. In all tested scenarios, no permissioned product entered the group of "meeting turnover threshold and dispersed holdings."
These findings do not mean that permissioned products must remove investor restrictions in order to develop a more active secondary market. While retaining fund KYC and transfer requirements, introducing eligible liquidity providers, as well as trading or lending venues, can also improve a product's ability to reach buyers and obtain financing.
A New Path for the Tokenized Equity Market
On September 15, the Senate failed to advance the CLARITY Act, and the timeline for broader digital asset market structure legislation in the United States remains uncertain. Meanwhile, tokenized products and trading venues have already developed even though the legislative framework has yet to be settled.
Two days later, the SEC issued an "innovation exemption," granting a five-year conditional exemption to certain venues and liquidity providers that support licensed trading of U.S.-listed equity tokens through automated market makers and liquidity pools.
Its scope of application is clear and includes requirements regarding eligibility, investor rights, and trading conditions. It is neither a substitute for comprehensive legislation nor does it mean that all tokenized securities can be traded without restrictions.
For tokenization, the real opportunity lies in connecting eligible investors with venues and liquidity providers that can support secondary trading. As long as the surrounding infrastructure can adapt, licensing requirements do not necessarily hinder market development. When measuring progress, in addition to watching policy steps, one should also look at whether a genuinely usable market has formed.
How Morpho Vaults Finance RWA Collateral
Secondary market trading is not the only way tokenized assets generate economic value. Credit demonstrates another path: using assets as collateral in lending markets.
Among the 27 Morpho lending markets that use direct RWAs or RWA-backed wrapped products as collateral, we identified 129 Vault and strategy addresses that provided funds at some point in the first half of the year. This includes 79 MetaMorpho V1 Vaults and 50 Vault V2 strategies that accessed the market through on-chain adapters.
At the end of the quarter, 54 addresses had positive reconstructed net deposits, including 26 in V1 and 28 in V2. Pendle principal tokens and other derivatives are traced down to their economically underlying assets; crypto-native yield products are excluded.
Net fund supply is reconstructed based on cumulative deposits minus cumulative withdrawals, with negative balances treated as zero. It is an approximate indicator of cash flows, not the current size of holdings, and its statistical scope is also smaller than the entire platform's RWA TVL.
The trend in the first half of the year was far from linear growth. For the identified Vaults and strategies, reconstructed net deposits were $120.4 million on January 1, fell to a low of about $49 million in late April, then rebounded in May and June, reaching a peak of $208 million on June 23 and closing the quarter at $187 million.
The structure driving this rebound changed markedly. Net funds provided through MetaMorpho V1 continued to contract in the first half of the year, while Vault V2 rose from nearly zero at the start of the year to about 92% of identified Vault fund supply by the end of the quarter. V2's expansion exceeded V1's contraction.

Figure: Fund supply obtained on Morpho using traceable RWAs as collateral. Traceable RWAs include direct RWA tokens, as well as wrapped products or derivatives whose economic exposure can be traced to the underlying RWA assets.
Fund exits within V1 were concentrated in specific strategies. Some larger thBILL positions, namely the Theo short-duration U.S. Treasury fund, and PT-reUSD, namely Pendle principal token positions linked to Re Protocol reUSD, exited; other strategies still retained or adjusted their RWA exposure in June.
In Morpho's Vault fund supply collateralized by RWAs, credit dominated by the end of the first half of the year. At the end of the quarter, net fund supply collateralized by private credit and consumer credit was about $120 million, followed by reinsurance at about $44 million, U.S. Treasuries at about $12 million, equities and preferred shares at about $9 million, and commodities at about $3 million.
Assets being used as collateral does not mean liquidity is no longer needed. If the borrower defaults, the lender needs a reliable way to sell or redeem the collateral.
For assets with longer redemption periods, a liquidity provider can advance stablecoins first and then wait for the fund redemption to be repaid. This provider finances this waiting period and bears the corresponding risk; therefore, its capital capacity and reliability are very important to the lending market.
The liquidity requirements of RWA assets depend on their use
To evaluate the value of a tokenized asset, one must first look at the product's intended use: investors holding it for yield need reliable redemption, traders need competitive execution conditions, and borrowers need reliable financing using collateral.
For yield-type products, one should examine subscription and redemption times, fees, eligibility requirements, and available exit absorption capacity.
For stock or commodity tokens, one should examine bid-ask spreads, executable size, slippage, trading hours, and market maker coverage.
For assets used as collateral, one should examine borrowing capacity, collateral discounts, price data sources, and liquidation or redemption arrangements.
A token can exist on the blockchain while still inheriting almost all the restrictions of the off-chain asset it represents. The value of tokenization grows only as more of the asset's behavior can be completed directly on the network. This includes how the asset is transferred, how it is settled, and how it is used across different financial applications.
A new channel for participation: $67.8 billion in perpetual contract volume versus $4.2 billion in spot volume
Perpetual contracts allow traders to establish long or short exposure to an asset without holding the underlying token. Unlike traditional futures, perpetual contracts have no expiration date, and traders only need to provide margin rather than paying the full value of the position.
Demand for price exposure can grow without the holdings or liquidity of the tokenized asset itself necessarily growing in tandem.
In June, stock perpetual contract volume on Hyperliquid and Lighter was about $67.8 billion, roughly 16 times the $4.2 billion in observable tokenized stock spot volume on DEXs and RWA-native platforms. From January to June, this monthly ratio ranged from about 10x to 17x.
Leverage and frequent position adjustments can amplify perpetual contract volume, while spot trading involves the exchange of the token itself. Therefore, higher notional perpetual contract volume does not prove that more actual capital is being deployed, that liquidity is deeper, or that investors are abandoning spot holdings.

Figure: Tokenized stock spot volume and leveraged perpetual contract notional volume, using monthly data and a logarithmic scale. The underlying assets covered by the two data sets are not exactly the same.
The stock perpetual contracts here provide synthetic exposure to individual stocks and stock indices, while spot refers to trading in tokenized stocks and ETFs. Both data sets include broad market exposure, with each trade counted only once, but the underlying assets covered are not exactly the same.
The observable spot data combines RWA-native on-chain trading venues such as Ondo Stocks with general-purpose DEXs, but does not include centralized exchange order books, brokerage platforms such as Robinhood, over-the-counter trading, alternative trading systems, and other off-chain executions. Robinhood Chain's public mainnet launched after the first half of the year, so it is analyzed separately.
This data set should be understood as observable on-chain spot activity, not total market volume.
Entering the third quarter, Ondo extended its tokenized stock business into derivatives. Ondo Perps launched publicly to eligible non-U.S. users in July, offering round-the-clock perpetual contracts on stocks, ETFs, and commodities, with up to 20x leverage and allowing tokenized securities to be used as collateral.
A few weeks after launch, Ondo updated its disclosure to report cumulative trading volume of $9 billion and open interest of $100 million; a subsequent update in September showed that more than $25 million in Ondo Stocks had been deposited as collateral.
Perpetual Contract Open Interest Reaches 121.3% of Tokenized Stock Market Cap
Open interest measures the notional value of perpetual contract positions that have not yet been closed, with each matched contract pair counted only once.
At the end of the first half, open interest in Hyperliquid stock perpetual contracts was approximately $2.5 billion, equivalent to 121.3% of the observable circulating market cap of tokenized stock spot. April was the first month in the observation period to exceed 100% at month-end, at 109.5%.
Traders provide margin, not the full notional amount, so this comparison does not represent an equivalent amount of actual capital deployed, nor does it represent ownership of tokenized stocks. Both metrics use daily snapshots at month-end UTC time, and the sets of underlying assets covered differ, but both include individual stocks and broad market exposure.
Funding Rate Dispersion Declines, but Cannot Be Directly Equated with Improved Liquidity
Traditional futures converge toward the spot price as they approach expiration. Perpetual contracts have no expiration date, so exchanges use funding fees to keep contract prices linked to the underlying asset.
When perpetual contract prices are above spot, longs typically pay funding fees to shorts; when below spot, shorts typically pay longs. Funding fees affect the cost of maintaining a position.
As of June, funding rate dispersion on both Hyperliquid and Lighter was below previous peaks. Hyperliquid continued to decline through June after peaking in March; Lighter declined from February to May, then rose again in June. Compared with the previous peak period, daily funding rates across contracts and dates were more concentrated.
Several factors may explain this change. Calmer underlying markets may reduce pricing deviations; deeper order books can mitigate the impact on prices and funding rates when buy and sell pressure changes; more balanced long and short demand may also play a role.
Distinguishing these causes matters: calmer markets mean the platform faces less stress, while deeper liquidity means the platform is better able to withstand stress. A decline in dispersion alone cannot prove that liquidity has improved, nor that the funding cost of an individual position is more predictable.
Some on-chain trading venues are connecting to liquidity that already exists in mature markets. Veranta, built by Avantis.fi, handles RWA trading by connecting to market makers from traditional trading venues; Variational Omni uses a request-for-quote model, in which its liquidity providers use external markets to price and hedge trades.
These approaches can help a platform support trading before it builds its own deep order book. For products that link funding fees to financing costs in traditional markets, rates also become less dependent on the imbalance between buyers and sellers within a single platform.
Robinhood Chain: A Test of Retail Distribution Channels in Early Q3
Robinhood Chain's public mainnet launched on July 1, 2026. Its platform for individual users provides a case for testing whether a diverse range of tokenized assets can translate into sustained demand.
Robinhood's Stock Tokens are debt securities that provide economic exposure to the underlying stocks but do not confer legal or beneficial ownership of those stocks.
This case uses early third-quarter data extending to late August and is not included in the first-half market totals. Early results show that measurable on-chain activity is growing, but the actual capital scale, liquidity, and holdings of stock tokens remain relatively concentrated.
The value of tracked tokenized assets rose from $5.6 million at the end of June before launch to $28.4 million at the end of July. Weekly RWA trading volume rose from $5 million in the first week after launch to $887.5 million in the last week of August, and its share of the chain's DEX trading volume rose from 0.1% to 12.9%.
On August 31, RWA daily trading volume reached $244.7 million, of which 38% was classified under the "stock trading" category. This trading volume metric counts swaps routed through Rialto involving identified token contracts, with the notional amount calculated on the USDC quote side.
These data cannot prove that consumers have widely adopted it, nor can they prove that stock tokens themselves have formed sustained demand.
As of August 3, of the 202 tracked RWA contracts, 96 had received funding. The number of transfers is also far higher than the actual level of economic participation: of the 63.8 million transfers in July, 86.2% were under $1, and the median transfer amount was $0.0014.
Over the longer window from July 1 to August 7, the top ten sending addresses contributed 89.4% of transfer counts. Therefore, a high number of transfers does not prove the existence of broad economic participation.
From trading activity to holdings with actual scale
In the token market cap snapshot, the 30 largest funded RWA tokens accounted for 97.6% of total tracked value; the top ten accounted for 58.2%; NVDA alone accounted for 15.9%.
Listed products of various types did not generally receive funding; instead, a small number of leading products led the way, followed by a long tail of assets with very small funding amounts.
The expansion in the number of listed products has also outpaced market formation. Of the 202 tracked RWA contracts, 96 once had asset value, 90 had recorded DEX trading, 68 had active liquidity at the snapshot, and 32 reached at least 100 wallets each holding a balance of $1 or more.
From first funding to first DEX trade, the median time for assets was 11 days; the second batch of listed products still had not received funding during the observation period. These are different stage-based metrics, not a unified conversion funnel, but they indicate that a rich product shelf can quickly exceed actual funding demand.
The balance snapshot on August 7 shows highly concentrated holdings. Of the 64,981 addresses with positive balances, 73.8% held less than $10; 669 addresses with balances of at least $1,000 accounted for only about 1% of current holder addresses, yet controlled 95.1% of tracked asset value.

Figure: Share of holder addresses and share of asset value by balance range on Robinhood Chain. About 1% of holder addresses control 95.1% of tracked asset value.