
Quant price has climbed back above $300 after a sharp late-September pullback, with daily momentum strengthening as traders watch resistance near $329.
Summary
- Quant price traded near $302, with Binance’s daily chart showing a 13.29% gain.
- Daily RSI reached 81.90, while MACD remained above its signal line.
- Weekly technical levels place nearby resistance at $312.50 and $343.75.
- CoinGlass shows major liquidation concentrations near $324–$327 and $278.
The recovery follows The Clearing House’s selection of Quant for its planned U.S. tokenized-deposit network.
TradingView’s Binance QNT/USDT daily chart showed the token at $302.26 on Sep. 30, with a session high of $329 and a low of $262.36. QNT had gained $35.46 from the daily opening price of $266.80, recovering above the $300 mark after its recent retreat.
The weekly chart placed QNT near $303.38, compared with a weekly low of $195.35. That represents a rebound of about 55% from the low, although the token remained below its late-September peak near $373.
Quant rebounds above $300 after a deep pullback
On the daily chart, QNT’s advance follows months of trading largely between $50 and $90. The late-September breakout carried the token through $100, $150, and $250 before reaching its recent peak.
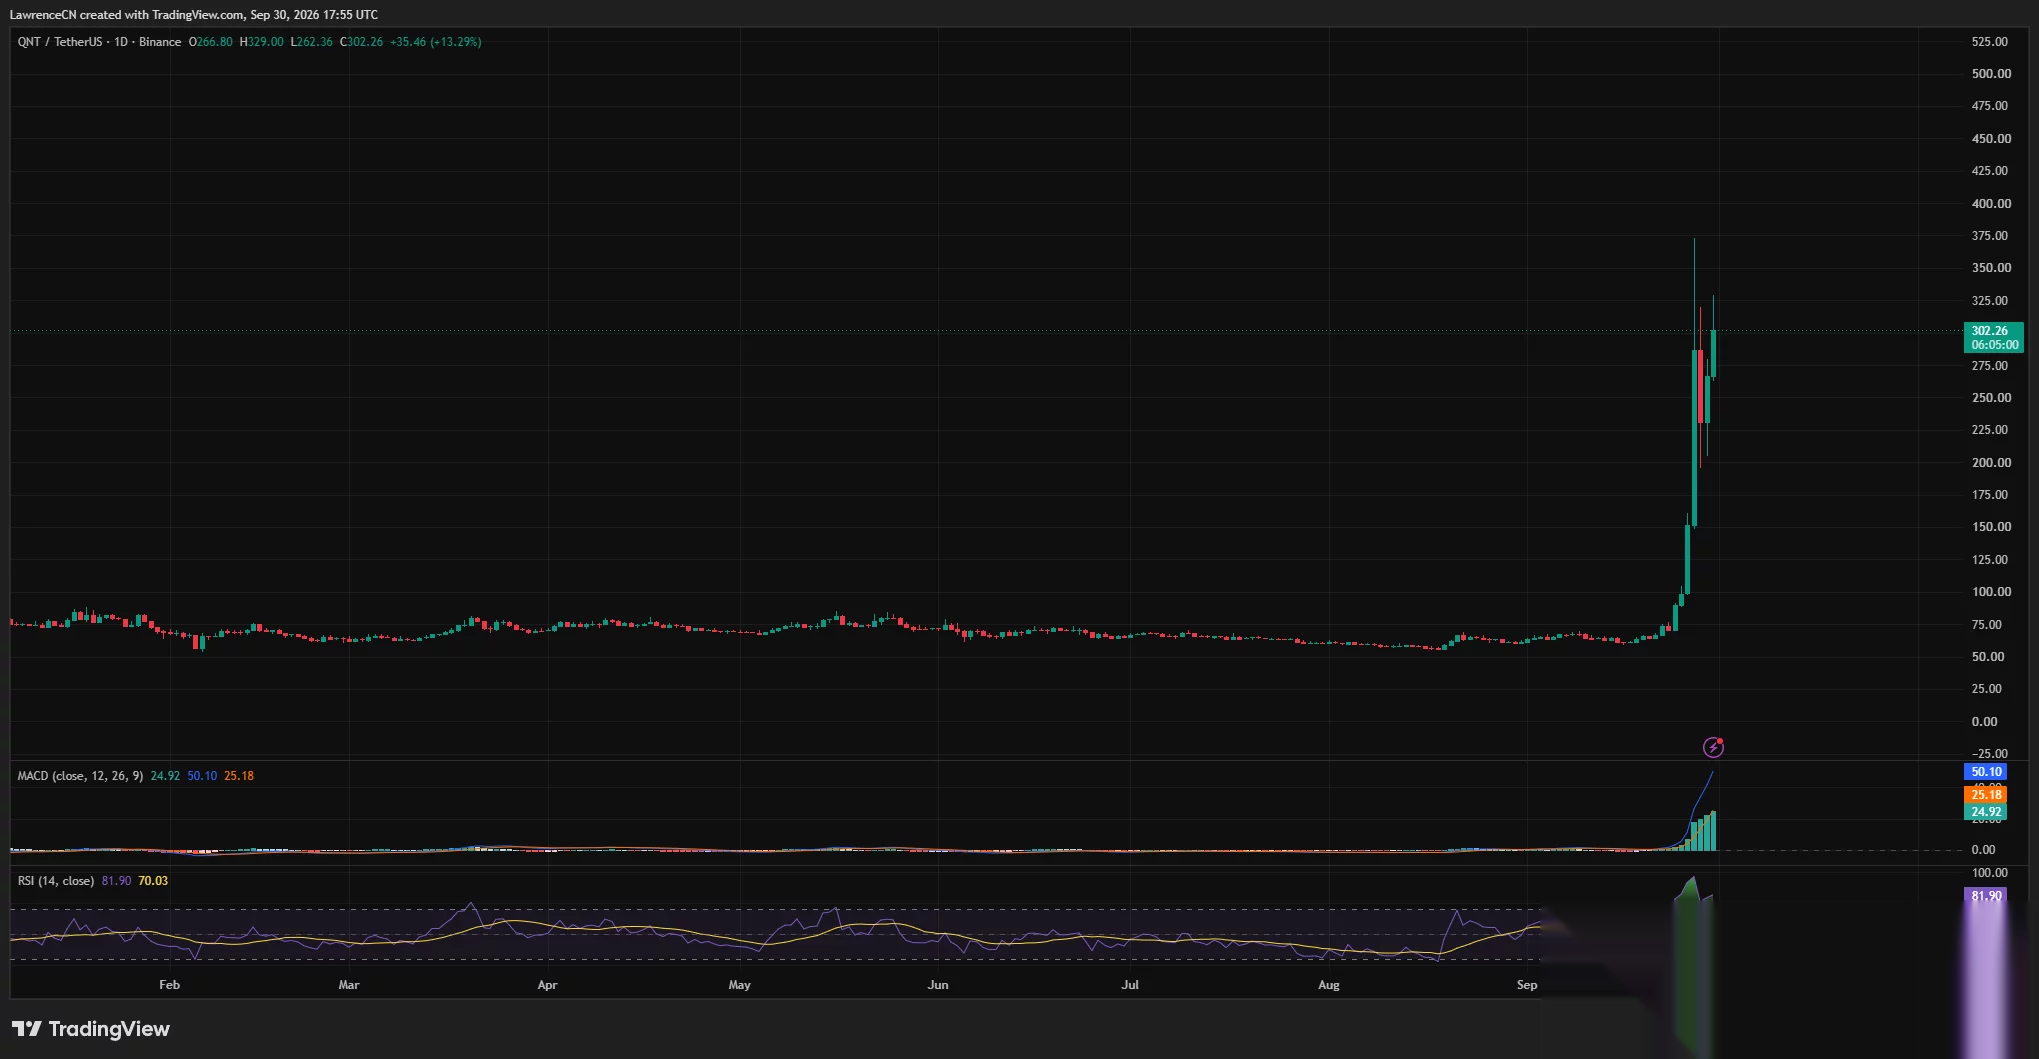
The subsequent decline brought QNT back toward $200, while the latest recovery has returned the price to the upper part of that expanded trading range. At $302.26, the token was still roughly 19% below $373.
TradingView’s session range also shows that volatility remains high. The gap between the daily low of $262.36 and the high of $329 was $66.64, equivalent to about 25% of the session’s opening price.
The daily chart places $329 as the nearest observed price barrier above $300. A move through that high would bring the recent peak near $373 back into view, with the weekly chart’s $343.75 technical level between them.
On the downside, the daily opening area near $266.80 and session low near $262.36 form the next visible price references beneath $300. The weekly chart adds intermediate levels at $281.25 and $250.
Daily RSI stays elevated as MACD strengthens
TradingView’s daily relative strength index stood at 81.90, above the conventional overbought threshold of 70. The RSI had eased from its earlier spike but remained elevated as QNT recovered.
The indicator’s moving average was 70.03, leaving the RSI above both that average and the overbought boundary. The readings show that the recent price advance remains strong, while QNT continues to trade with stretched daily momentum.
The daily moving average convergence divergence indicator also remained positive. Its MACD line stood at 50.10, compared with a signal line of 25.18, producing a positive histogram reading of 24.92.
On the chart, the MACD line continued rising after the initial breakout, while the histogram remained above zero. The momentum readings therefore accompanied the recovery above $300 rather than showing a bearish crossover.
The weekly Chaikin Money Flow reading was also positive at 0.35. That volume-based indicator had risen sharply from negative territory during the breakout, adding another positive technical reading on the longer timeframe.
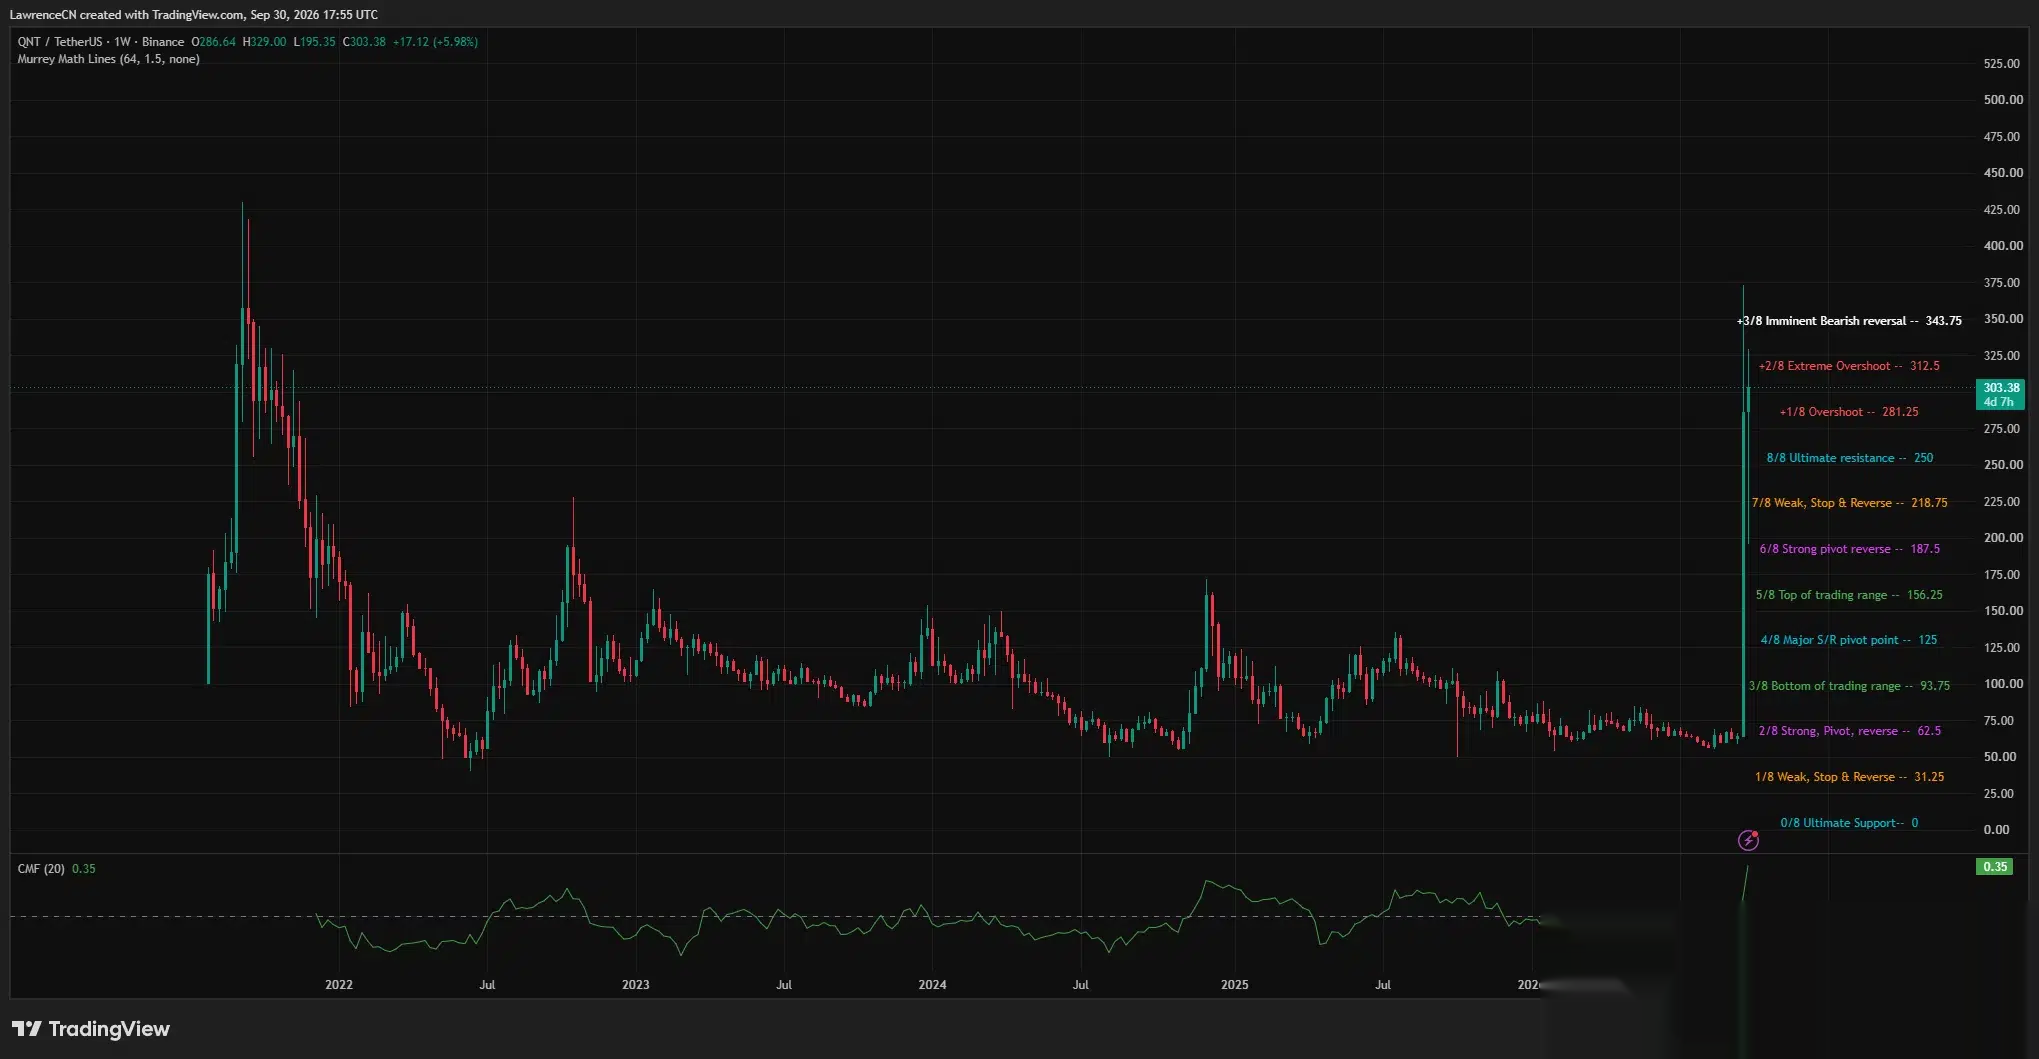
However, the weekly Murrey Math overlay placed price between $281.25 and $312.50. QNT was above the lower level but had yet to hold above the next band, keeping $312.50 directly within the current resistance area.
Liquidation clusters build around $278 and $327
CoinGlass’s 24-hour QNT liquidation heatmap showed price rising from around $250 to approximately $327 before retreating toward $300.
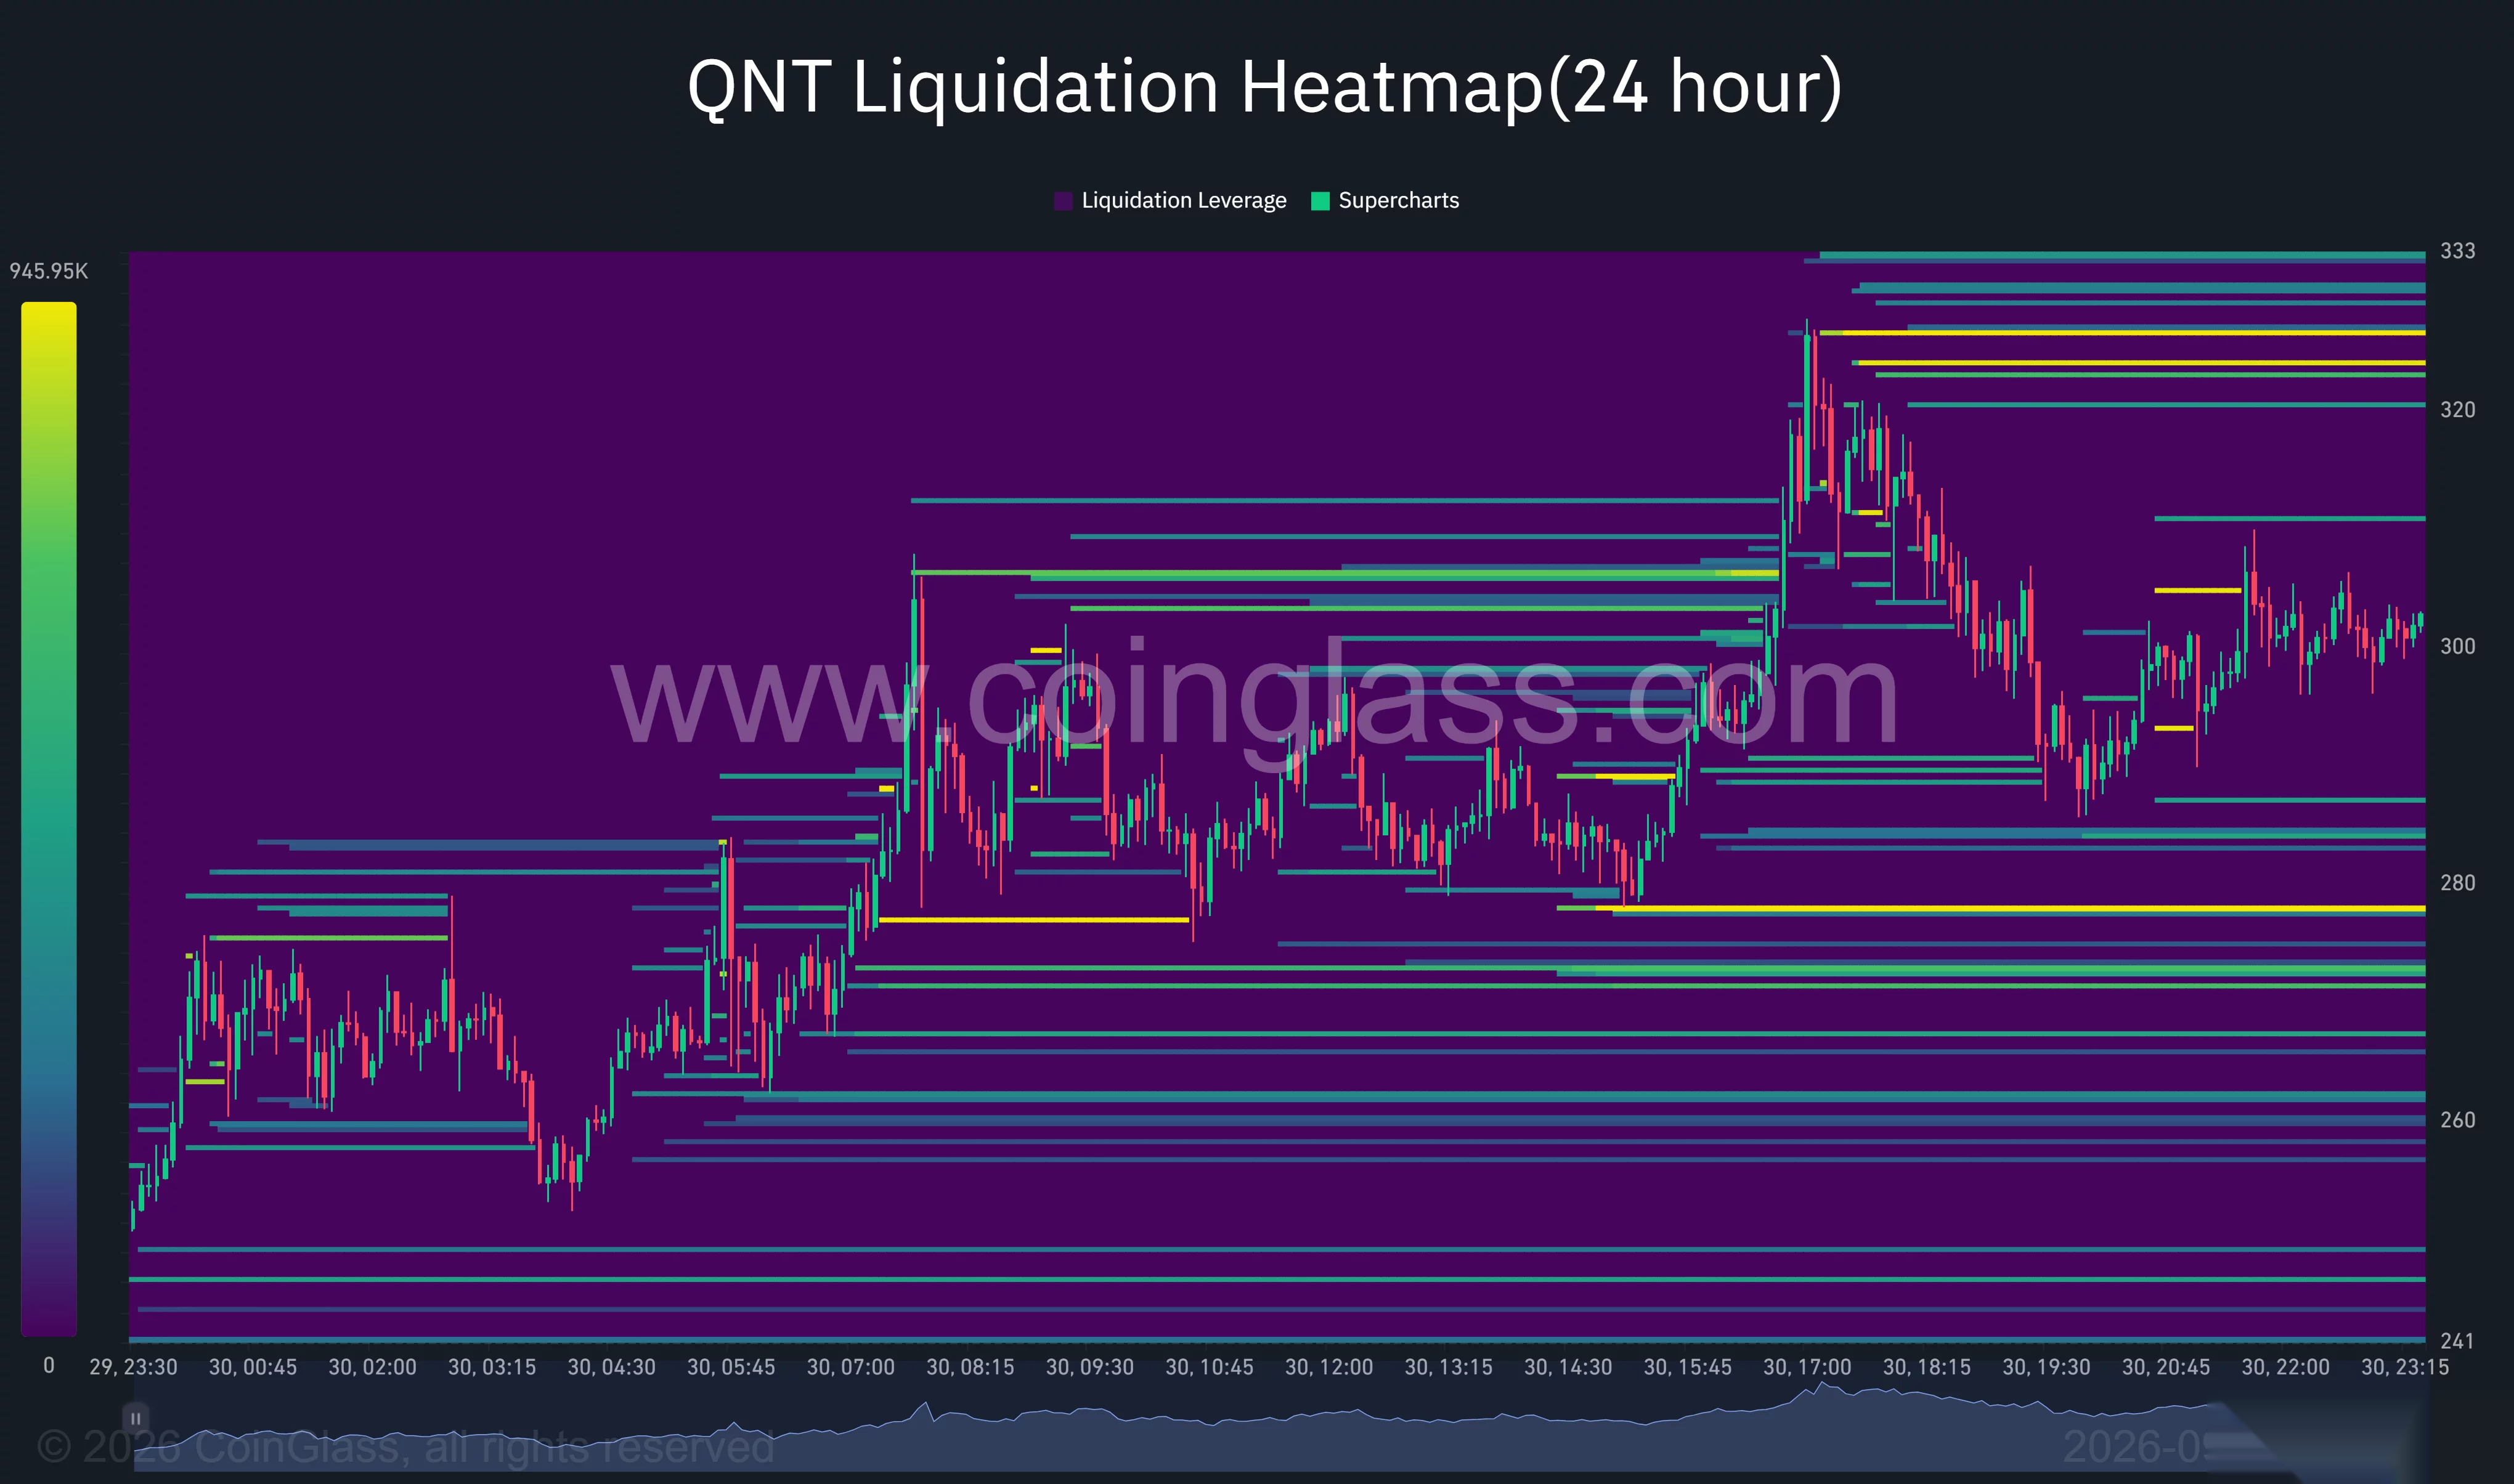
The brightest remaining bands above price were concentrated near $324–$327. Additional bands appeared around $320 and $330–$333, placing several estimated liquidation concentrations near the daily high.
Below price, one of the strongest bands sat around $278. Other concentrations appeared near $271–$273, with further bands around $260–$263.
The heatmap also showed QNT recovering after a later dip toward the upper $280s. By the end of the displayed period, price was fluctuating around $300–$303, between the major upper and lower liquidation zones.
Analyst Ted Pillows described QNT as breaking out of a five-year downtrend in a post on X. His accompanying weekly chart showed price moving above a descending trendline drawn from the 2021 peak.
Pillows suggested that QNT could double from the level shown in his post if momentum continued. His chart displayed QNT near $186.57, placing that conditional projection around $373 rather than twice the latest $302 price.
Separately, the X account Crypto nerd described a bull-flag breakout and projected a move above $400. That forecast would require QNT to clear both the current $329 barrier and its recent peak near $373.
U.S. banking deal sets a first-half 2027 milestone
The Clearing House announced on Sep. 24 that Quant would provide technology for its On-Chain Money Initiative, a planned network for clearing and settling tokenized bank deposits.
According to the announcement, Quant will supply the technology that connects systems and coordinates transactions, including links to the existing RTP and CHIPS payment networks. The U.S. payments operator said its current networks clear and settle more than $2 trillion daily.
The organization expects the new network to become available to participating institutions in the first half of 2027. It identified corporate treasury, liquidity management, cross-border payments, and digital-asset settlement as intended uses.
For QNT’s immediate technical setup, TradingView places $312.50 and $329 above the current price, followed by $343.75 and the recent peak near $373. A retreat below $281.25 would instead return attention to the $278 liquidation concentration, the daily low near $262, and the weekly $250 level.