
A reserve ratio compares what an exchange holds in an asset against what it owes users in that same asset. The number is simple to compute and easy to misread, because a single blended figure can hide a shortfall in one coin behind a surplus in another. Read it per asset, ask what went into the denominator, and it becomes one of the most useful lines in any disclosure.
What the reserve ratio is
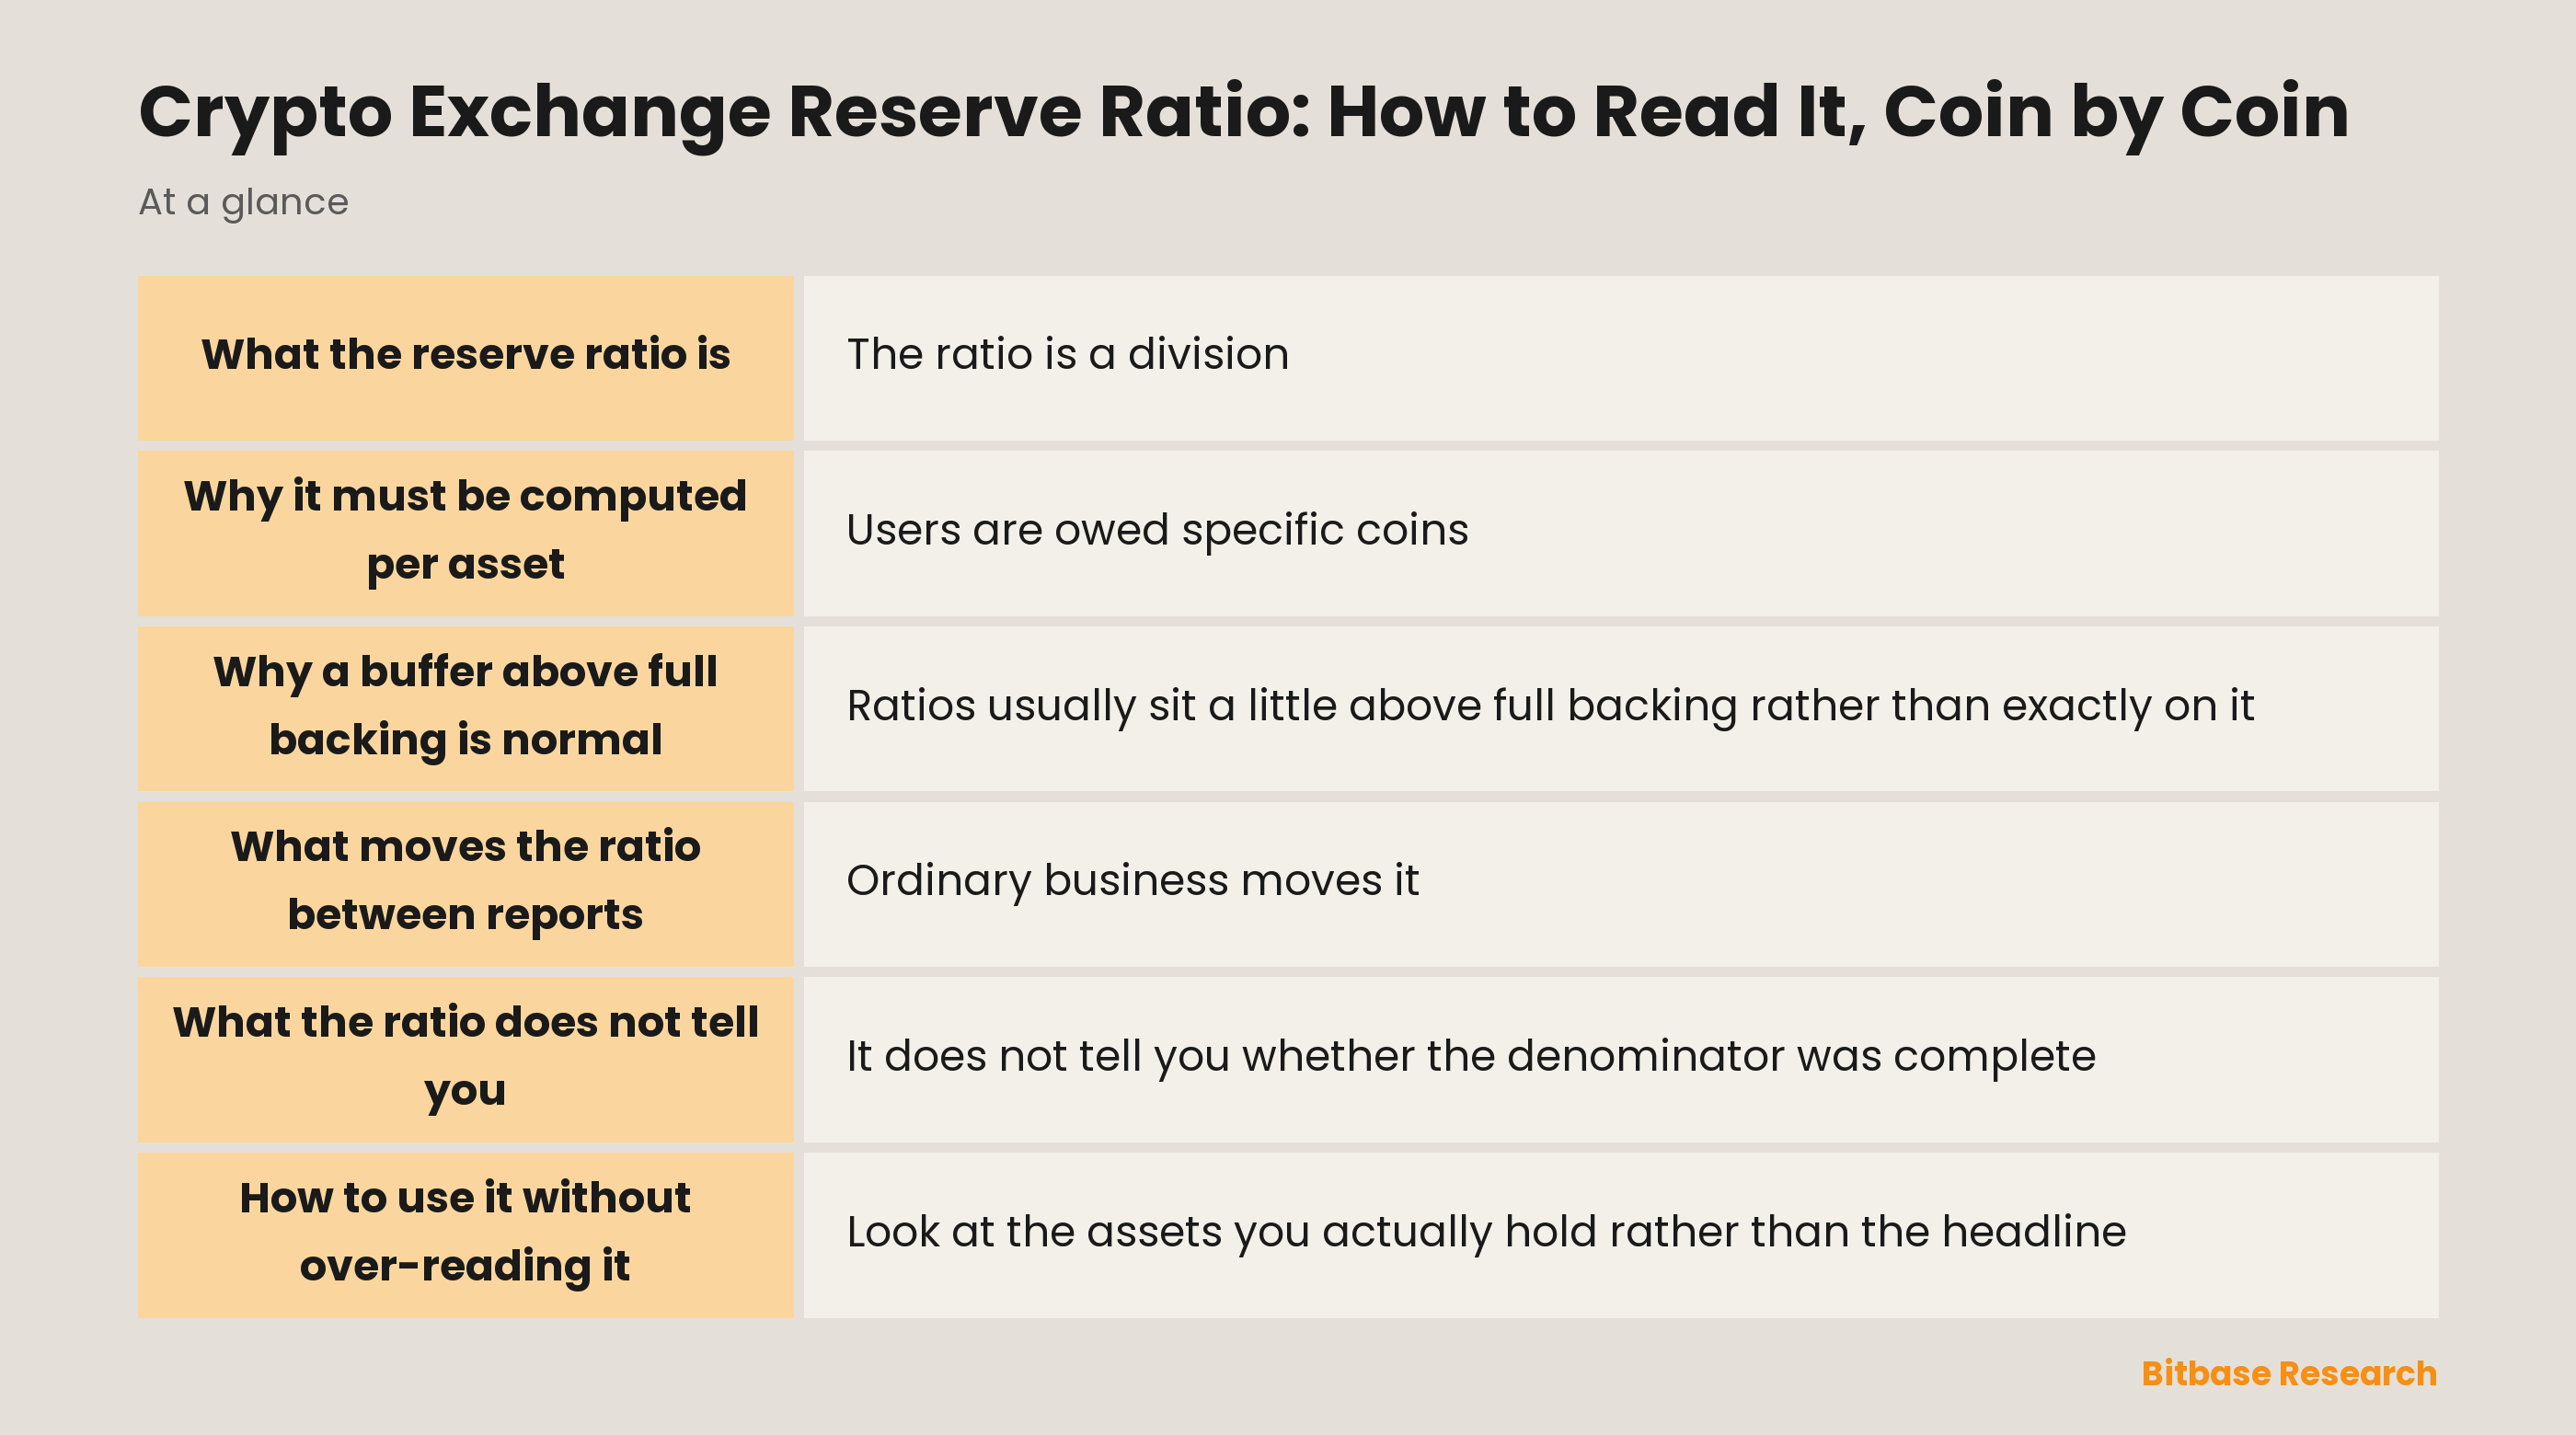
The ratio is a division. On top sits the amount of an asset the exchange demonstrably holds; underneath sits the amount of that asset owed to users at the same moment. Full backing means the top is at least as large as the bottom.
Both quantities come from different places, and that is the part worth remembering. The numerator is read from public chains, where anyone can check it. The denominator comes from the exchange's own ledger and reaches you as a committed set of balances rather than as something you can independently observe.
The two halves also age differently: the numerator can be re-checked at any moment by anyone, while the denominator is fixed at the snapshot and cannot be revisited afterwards. So the ratio is a hybrid measurement. Half of it is verifiable by strangers and half of it is asserted by the party being measured, which is exactly why the question of what went into the denominator matters as much as the number itself.
How to read a reading
| Reading | What it means | What to ask next |
|---|---|---|
| Below full backing for an asset | Holdings are smaller than counted balances | Is it disclosed openly, and what is the remedy |
| Exactly at full backing | Holdings match the counted balances | Which balances were counted |
| Modestly above | A buffer sits above counted balances | Whose funds make up the buffer |
| Far above | Usually a small or thinly held asset | Is the denominator tiny rather than the holdings large |
| Absent for an asset | That asset is outside the report's scope | Why is it excluded, and how large is it |
| Only a blended total | Per-asset shortfalls can hide inside it | Where is the per-asset breakdown |
The last row is the one that does the most work. A single number across all assets is an average, and averages conceal exactly the thing you are checking for.
Why it must be computed per asset
Users are owed specific coins, not value. Somebody who holds one asset on a platform expects to withdraw that asset, and a surplus in an unrelated coin does not satisfy that expectation without a trade that the user did not ask for.
That is why blending is misleading rather than merely coarse. An exchange could hold a large surplus in one widely held asset and a deficit in another, and a combined figure computed in dollar terms would look comfortable while the second group of users faces a queue.
The same logic applies to assets that share a name across networks, where a surplus on one chain does not help a user waiting on another. Per-asset reporting removes that possibility, which is why the presence of a per-asset table is itself a signal about the disclosure. Reading the rest of the fields around it is covered in how to read a proof of reserves report.
Why a buffer above full backing is normal
Ratios usually sit a little above full backing rather than exactly on it. That is not generosity and not a sign of unusual strength; it is what happens when an operator keeps its own funds on the same infrastructure and when balances move between the snapshot's cut-off and settlement.
A small buffer is therefore unremarkable and a very large one deserves a question rather than applause. Far above full backing often means the denominator is small, which happens with assets few users hold, so the ratio moves a lot on very little activity.
It is worth noticing that a buffer belonging to the operator is a different fact from a buffer that exists because balances were undercounted, and only the methodology distinguishes them. The useful reading is directional. Full backing or slightly above across the assets that matter to you is the ordinary healthy picture; a pattern of ratios that swing wildly between reports is worth understanding before it is worth admiring.
What moves the ratio between reports
Ordinary business moves it. Users deposit and withdraw, and both sides of the division change constantly, so two consecutive reports differ for reasons that have nothing to do with anything going wrong.
Scope changes move it too, and this one is easy to miss. Adding an asset to the report, changing which wallets are included, or changing how a staked or locked position is counted all shift the number without any coin moving anywhere.
A responsible disclosure says which of these happened, and says it in the same document rather than leaving the reader to infer it. That is why a ratio should be read alongside the methodology rather than as a standalone figure. When a number changes noticeably, the first question is whether the measurement changed rather than the reserves.
What the ratio does not tell you
It does not tell you whether the denominator was complete. Balances left out of the count make the ratio look better, and no reader can detect that from the ratio itself.
It does not tell you whether the assets are unencumbered. Coins that are borrowed or pledged appear in the numerator exactly like coins that are free, because a chain shows a balance rather than a claim against it. These and three other structural gaps are laid out in the limitations of proof of reserves.
And it does not tell you about obligations outside customer balances. A platform can show full backing on every asset and still owe money elsewhere, which is the distinction drawn in does proof of reserves prove solvency.
How to use it without over-reading it
Look at the assets you actually hold rather than the headline. Your exposure is to specific coins, and a ratio for a coin you do not hold tells you nothing about your own position.
Compare across reports rather than across platforms. Methodologies differ enough that two exchanges' figures are not directly comparable, while the same exchange measured the same way over several periods produces a trend that means something.
It also helps to look at how the report handles the assets that are hardest to count, since those are where methodology choices show up most clearly. Treat a per-asset table, a stated methodology, and a stable series as the three things worth having. Their absence is more informative than any single value, because it tells you what the publisher chose not to show.
The bottom line
A reserve ratio divides demonstrable holdings by counted user balances, and it should be read one asset at a time. Blended totals hide shortfalls, buffers above full backing are ordinary, and large swings usually mean the measurement changed rather than the reserves.
Used carefully, it is the most compact summary of the asset side that exists. Used carelessly, it is a single number that appears to answer a question it never addressed. For more from Bitbase Academy, keep reading.
Related reading
Other Bitbase articles on this topic:
- Bitbase KYC and Verification: Three Different Checks That Share One Word
- Where Is Bitbase Regulated? The Registrations, and What They Do Not Mean
- How to Check If a Crypto Exchange Is Safe: A Checklist You Can Actually Run
- Realized PnL Report vs Transaction History: Which Record Your Taxes Need
- What Is Crypto Wallet Encryption? How Your Keys Stay Safe
Disclaimer: This article is educational content from Bitbase Academy, provided for information only. It does not constitute investment, trading, tax, or financial advice. Crypto assets are volatile; assess your own risk. Written as of September 2026; refer to the latest official information.
References
[1] Bitbase, Proof of Reserves — monthly disclosure, Merkle root and open-source verifier www.bitbase.com