The RSI, or relative strength index, is one of the most popular momentum indicators, and for good reason: it condenses how strongly price has been moving into a single number between 0 and 100. That simple scale makes it easy to see when a move may be getting stretched. But the RSI is also widely misunderstood, so knowing what it really says matters. Here is how the RSI works and how to read it sensibly.
What the RSI measures
The RSI measures the momentum of price by comparing the size of recent gains to recent losses over a set period, usually 14. It expresses the result on a scale from 0 to 100. A high RSI means recent gains have dominated and momentum is strongly up; a low RSI means losses have dominated and momentum is strongly down. Around the middle, near 50, gains and losses are roughly balanced. So the RSI is essentially a momentum gauge condensed into one bounded number.
Overbought and oversold
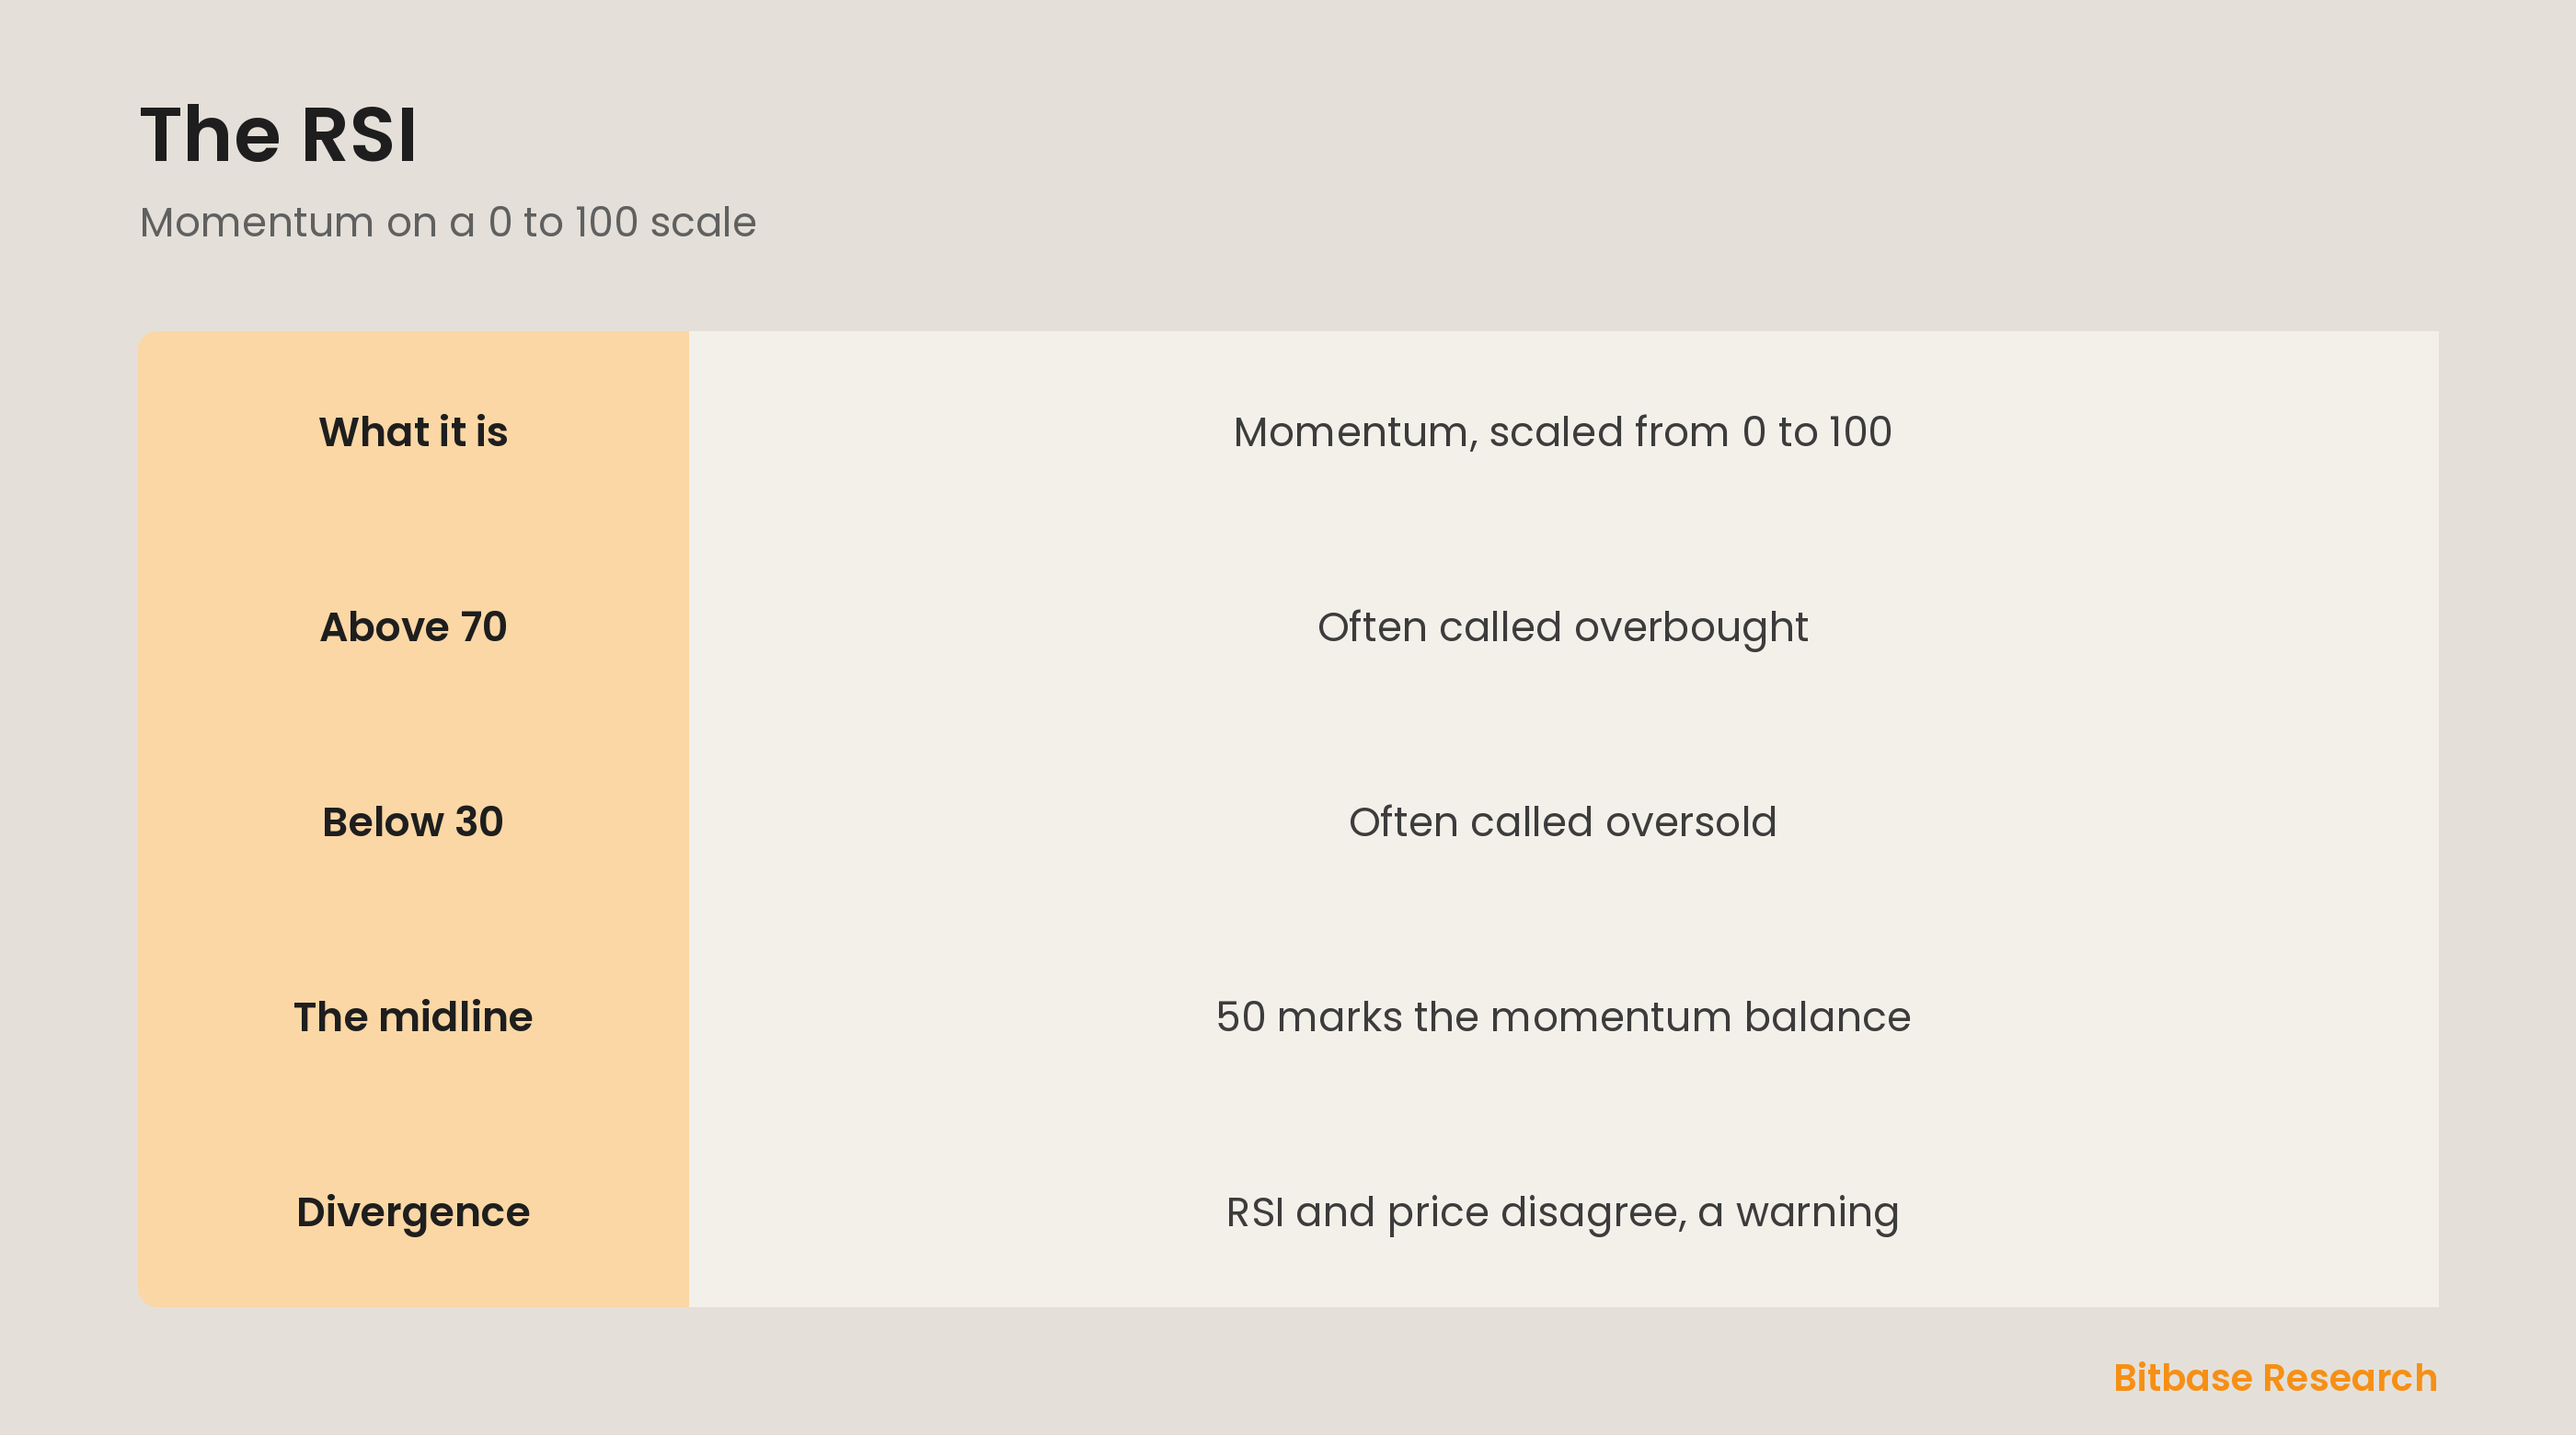
The most famous RSI levels are 70 and 30. When the RSI rises above 70, it is often called overbought, meaning price has risen quickly and momentum is stretched. When it falls below 30, it is called oversold, meaning price has dropped fast. It is important to understand these do not mean price must reverse; in a strong trend the RSI can stay overbought or oversold for a long time. They flag a stretched move, not a guaranteed turn.
The midline and trend
The 50 level is underrated. Because it marks the balance between gains and losses, which side of 50 the RSI sits on hints at the underlying trend: readings that stay above 50 suggest bullish momentum, while readings that stay below suggest bearish momentum. Some traders use the midline more than the extremes, watching whether the RSI holds above or below 50 to gauge which way momentum is leaning across the whole move, not just at the extremes.
RSI divergence
One of the RSI's most valued signals is divergence, when it disagrees with price. If price makes a higher high but the RSI makes a lower high, momentum is weakening even as price rises, a bearish divergence that warns the uptrend may be tiring. The reverse, price making a lower low while the RSI makes a higher low, is a bullish divergence. Divergence does not pinpoint the turn, but it reveals momentum fading beneath the surface of price.
Reading an RSI Value
| What you see | What it means | What it does not mean |
|---|---|---|
| Above the upper band | Recent gains have dominated | Not that price has to fall |
| Below the lower band | Recent losses have dominated | Not that price has to rise |
| Near the midline | Gains and losses are roughly balanced | Not that a trend has ended |
| Rising while price falls | Momentum is diverging upward | Not a timing signal on its own |
| Falling while price rises | Momentum is diverging downward | Not a timing signal on its own |
| Pinned at an extreme for weeks | The trend is strong | Not that a reversal is overdue |
The right-hand column is the whole discipline: the RSI describes momentum that has already happened, and nothing in it obliges price to do anything next.
The bottom line
The RSI measures momentum on a scale from 0 to 100 by weighing recent gains against recent losses. Above 70 is often called overbought and below 30 oversold, but in a strong trend the RSI can stay stretched without reversing, so these are warnings, not guarantees. The 50 midline hints at the underlying trend, and divergence between the RSI and price flags fading momentum. Like any indicator, the RSI works best confirmed by context, not traded alone. To keep learning the fundamentals, follow more from Bitbase Academy.
Frequently asked questions
How is the RSI calculated?
It compares the size of recent gains to recent losses over a set lookback period and expresses the result on a fixed scale, so a high value means gains have dominated that window and a low value means losses have. Changing the lookback changes how quickly the line reacts, which is why two charts of the same asset can disagree.
Does an overbought RSI mean I should sell?
No. Overbought describes momentum that has already happened, not an instruction, and in a strong trend the reading can stay extreme for weeks while price keeps going. Treating the band as a trigger is the most common way the indicator is misused.
Why does the RSI behave differently in a trend?
Because it measures gains against losses, a market that keeps making gains keeps the value high by construction. In a trending market the midline is often the more useful reference, since crossings there describe a shift in balance rather than an extreme.
Related reading
Other Bitbase articles on this topic:
Disclaimer: This article is educational content from Bitbase Academy, provided for information only. It does not constitute investment, trading, tax, or financial advice. Crypto assets are volatile; assess your own risk. Written as of June 2026; refer to the latest official information.
References
[1] Investopedia, "Relative Strength Index (RSI) Indicator Explained" investopedia.com
[2] Investopedia, "Technical Analysis: What It Is and How to Use It" investopedia.com
[3] Investopedia, "Price Action: What It Is and How Stock Traders Use It" investopedia.com